 English
  Русский
 Bahasa Indonesia
 Bahasa Malay
 ไทย
ไทย Español
 Deutsch
 Български
 Français
 Tiếng Việt
 中文
中文 বাংলা
বাংলা हिन्दी
 Čeština
 Українська
 Română

Trend Analysis
This week, from the level of 1.3478 (closing of the last weekly candle), the price may start moving downward with the target of 1.3270 – the historical support level (blue dotted line). When testing this level, the price may rebound upward with the target of 1.3332 – the lower fractal (weekly candle of September 21, 2025).
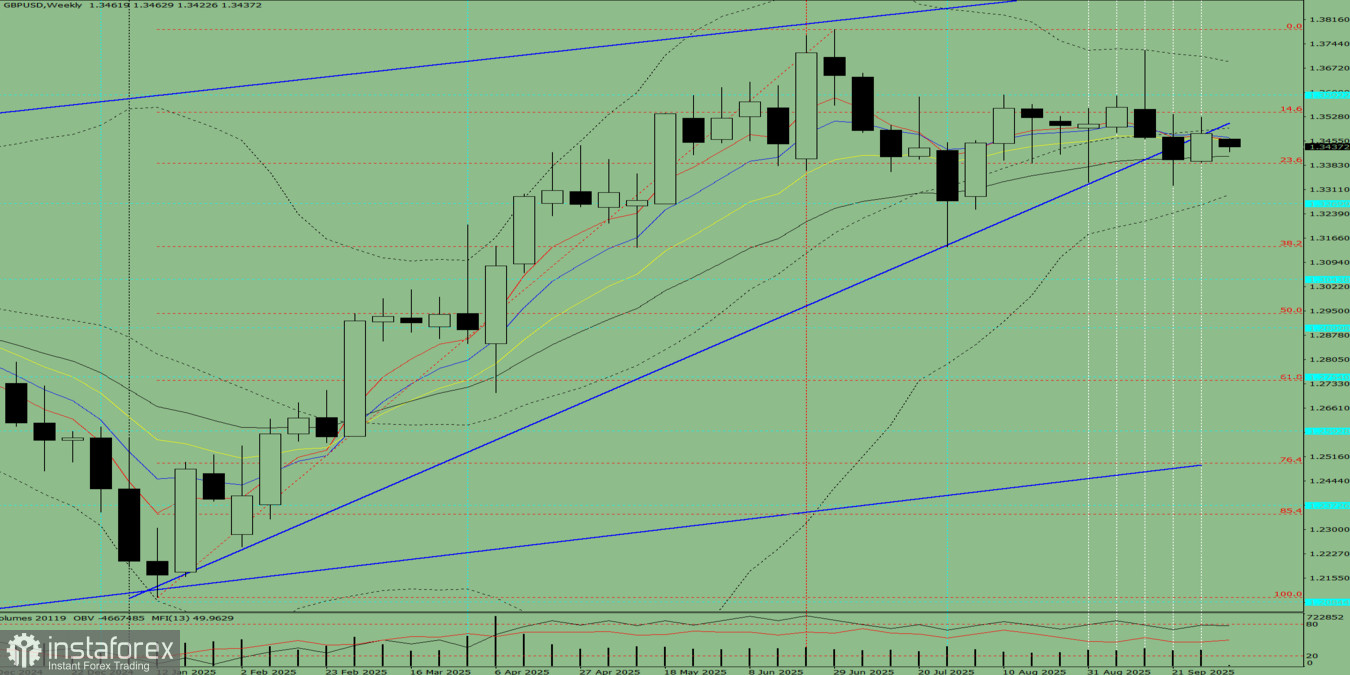
Fig. 1 (weekly chart).
Comprehensive Analysis
- Indicator analysis – down;
- Fibonacci levels – down;
- Volume – down;
- Candlestick analysis – down;
- Trend analysis – down;
- Bollinger Bands – down;
- Monthly chart – down.
Overall conclusion for the GBP/USD weekly chart: The price this week will most likely have a downward tendency, with the absence of an initial upper shadow on the weekly black candle (Monday – down) and the presence of a second lower shadow (Friday – up).
Alternative Scenario: From the level of 1.3478 (closing of the last weekly candle), the price may continue moving downward with the target of 1.3141 – retracement level 38.2% (red dotted line). Upon reaching this level, the price may move upward with the target of 1.3270, the historical support level (blue dotted line).