 English
  Русский
 Bahasa Indonesia
 Bahasa Malay
 ไทย
ไทย Español
 Deutsch
 Български
 Français
 Tiếng Việt
 中文
中文 বাংলা
বাংলা हिन्दी
 Čeština
 Українська
 Română

Analysis of EUR/USD on the 5-Minute Chart
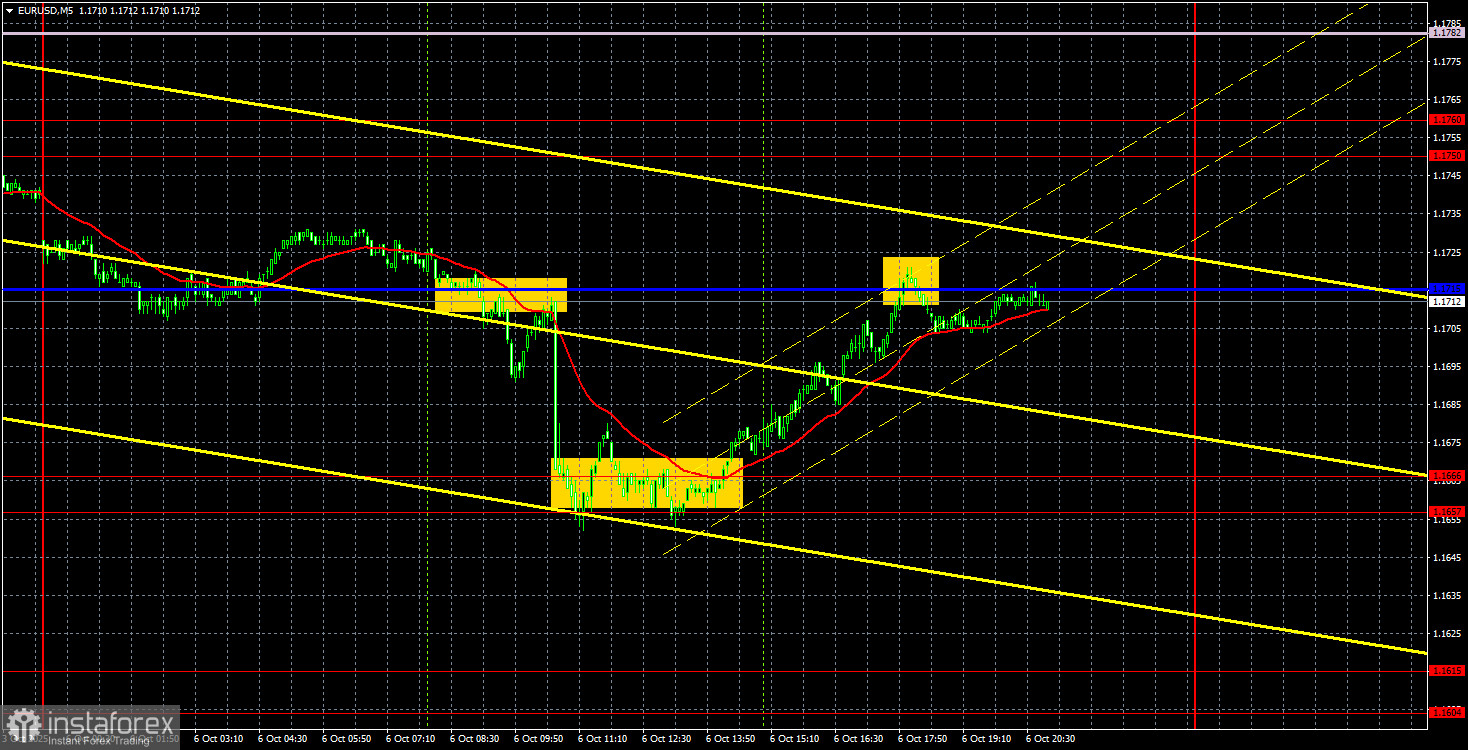
The EUR/USD currency pair experienced a sharp decline on Monday but rebounded almost as quickly. What do these two opposing movements tell us?
First, the European currency most likely dropped due to the political crisis in France. Although we don't view this factor as significant—given France experiences political crises regularly—the market may have reacted to the news regardless.
Second, the quick recovery of the euro appears to be a result of bargain buying. Traders saw an attractive exchange rate and quickly started purchasing. This tells us that no one in the market is seriously considering medium-term purchases of the U.S. dollar.
From a technical standpoint, we continue to observe a market characterized by "pushing and treading water" within a limited price range. The price dropped toward recent local lows yesterday but failed to continue declining. Therefore, as before, we expect a new rise in the euro, particularly in the medium term.
To confirm the completion of the downward trend, traders need to see a consolidation above the Senkou Span B line. There remain more than enough negative factors weighing on the dollar.
Yesterday, the 5-minute timeframe yielded three trading signals. Around the Kijun-sen line, there were two sell signals. The first was very strong. The price then dropped to the 1.1666 level, around which it hesitated for quite some time. Eventually, it consolidated above this level, and a new level at 1.1657 was added. After a slightly inaccurate rebound from this level, the price returned to the critical line. As a result, traders had the opportunity to open two profitable trades yesterday.
COT Report
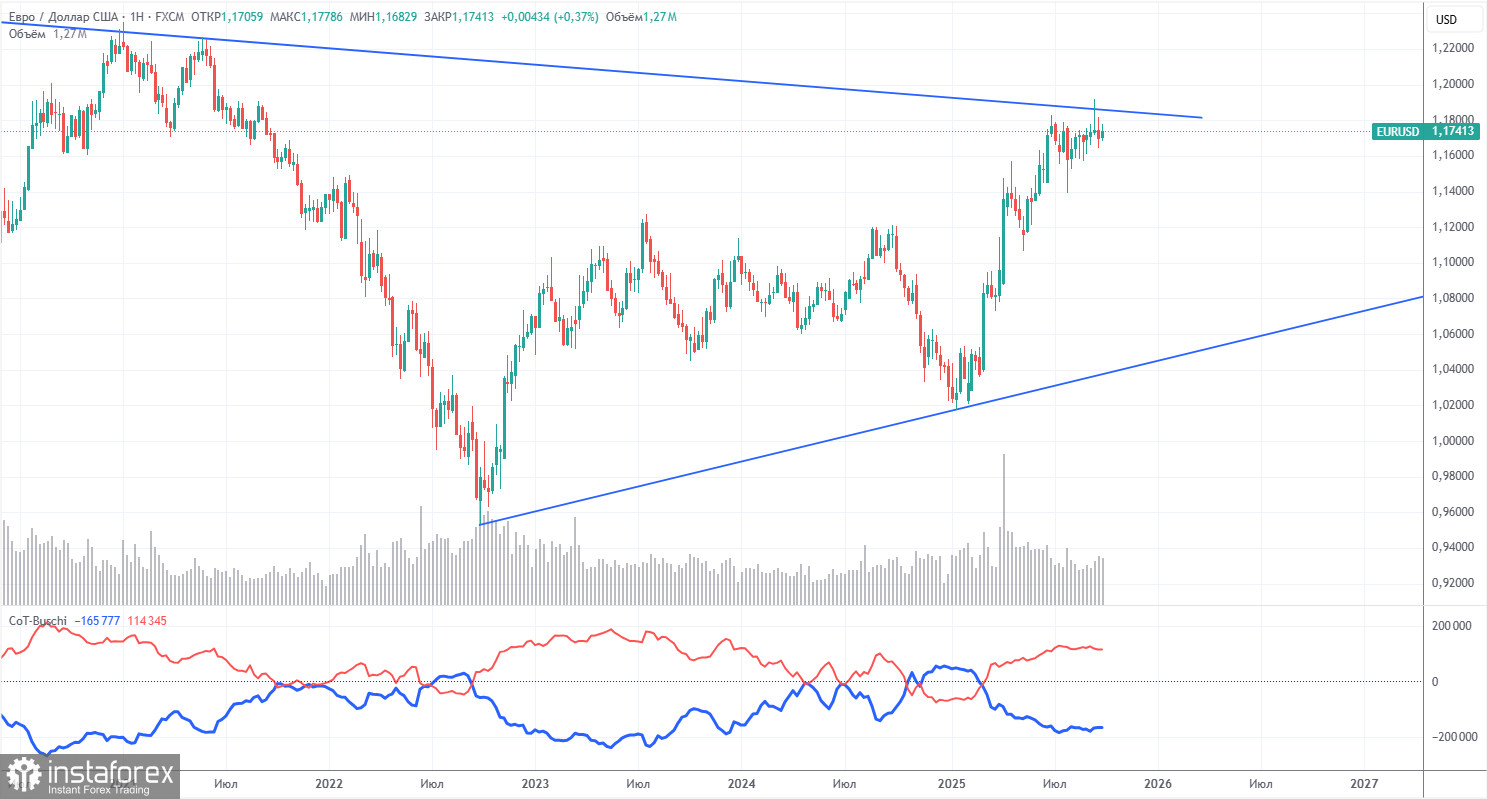
The latest COT report is dated September 23. The chart above clearly shows that the net position of non-commercial traders remained "bullish" for a long time. Bears were only able to gain the upper hand briefly at the end of 2024 and quickly lost it again. Since Trump assumed office as U.S. President for the second time, the dollar has continued to decline.
While we can't say with certainty that the dollar's decline will continue, current global developments point toward that outcome.
We still don't see any fundamental reasons to support the euro's growth. However, the dollar continues to face a sufficient number of factors that contribute to its weakness. The global downtrend remains intact, but at this point, does it matter how the price moved over the past 17 years? Once Trump ends his trade wars, the dollar may begin to recover. However, recent events indicate that the "war" will persist in some form. The potential loss of the Federal Reserve's independence is also a powerful negative factor for the U.S. currency.
The layout of the red and blue lines on the indicator continues to indicate a bullish trend. During the latest reporting week, the number of long contracts held by the "Non-commercial" group decreased by 800, while the number of short contracts increased by 2,600. As a result, the net position declined by 3,400 contracts over the week.
Analysis of EUR/USD on the 1-Hour Chart
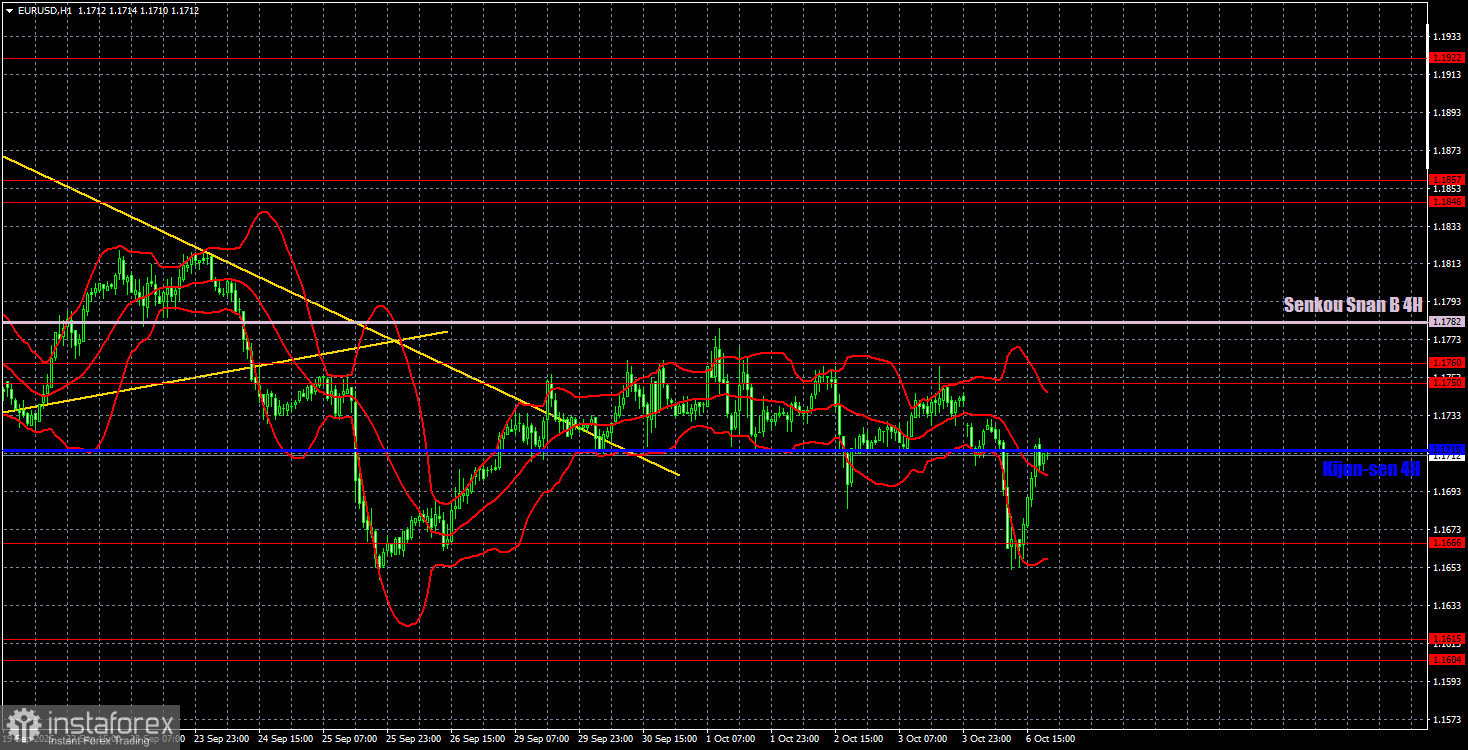
On the hourly timeframe, the EUR/USD pair continues to form a downward trend. However, this cannot be considered fully concluded since the price is moving sideways and hasn't breached the 1.1750–1.1760 zone or the Senkou Span B line. Still, there's no clear basis for expecting a strong dollar rally. The daily timeframe shows that the overall upward trend remains in place.
For October 7, the following levels are important for trading:
1.1234, 1.1274, 1.1362, 1.1426, 1.1534, 1.1604–1.1615, 1.1657–1.1666, 1.1750–1.1760, 1.1846–1.1857, 1.1922, 1.1971–1.1988, as well as Senkou Span B (1.1782) and Kijun-sen (1.1715).
Ichimoku indicator lines can shift throughout the day, and this must be taken into account when determining trading signals. Remember to place a Stop Loss at breakeven if the price moves 15 pips in the expected direction. This helps to avoid unnecessary losses if the signal turns out to be false.
On Tuesday, European Central Bank President Christine Lagarde is set to speak again in the Eurozone, but we don't expect any significant developments. She has already commented on the latest inflation data, noting that the current inflation level is acceptable to the ECB. In contrast, the U.S. economic calendar is entirely empty.
Trading Recommendations
On Tuesday, the recovery of the European currency may resume. Traders still need to overcome the 1.1750–1.1760 zone and the Senkou Span B line to consider the downward trend conclusively over and begin anticipating a new upward trend. A break above the Kijun-sen line will also allow for the opening of long positions.
Explanation of Illustrations
Support and resistance levels – thick red lines where price movement may come to a halt. These are not sources of trading signals.
Kijun-sen and Senkou Span B lines – Ichimoku indicator lines transferred from the 4-hour to the 1-hour timeframe. These are considered strong lines.
Extreme levels – thin red lines from which the price previously bounced. They function as trading signal points.
Yellow lines – trend lines, trend channels, and various other technical patterns.
Indicator 1 on the COT charts shows the net position size for each category of traders.