 English
  Русский
 Bahasa Indonesia
 Bahasa Malay
 ไทย
ไทย Español
 Deutsch
 Български
 Français
 Tiếng Việt
 中文
中文 বাংলা
বাংলা हिन्दी
 Čeština
 Українська
 Română

On the weekly chart, the price has reversed from the upper boundary of the price channel. Multiple divergences have formed between the price and the Marlin oscillator. The Marlin signal line itself is moving within its own descending channel.
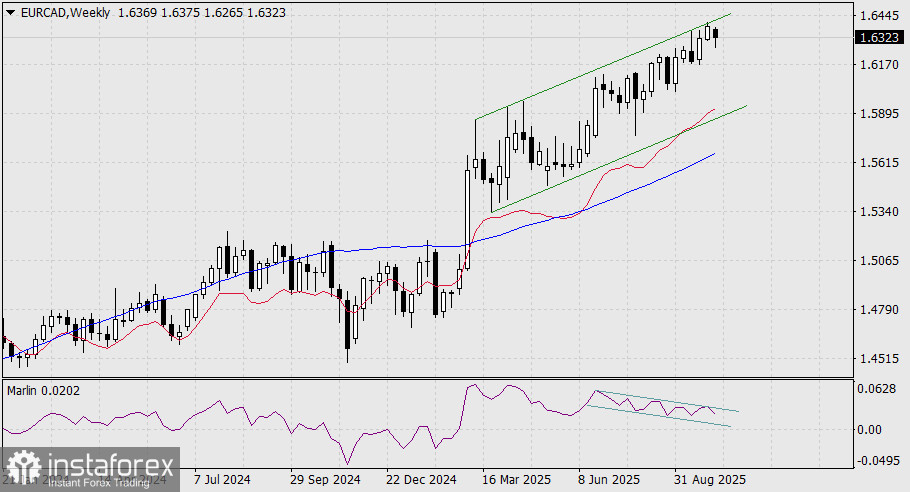
The Marlin oscillator is approaching the boundary of the bearish zone. If it manages to consolidate below this level (previous attempts have been unsuccessful), it could provide strong support to the price, helping to realize its bearish intent.
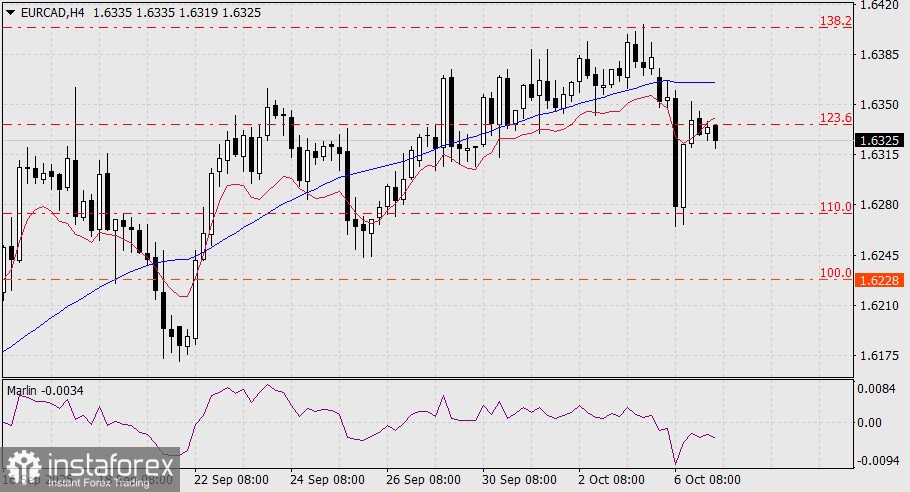
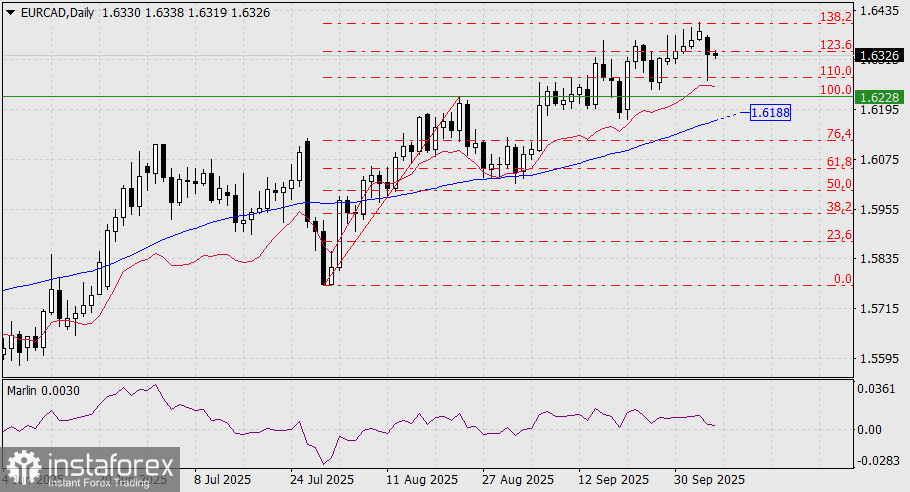
On the 4-hour chart, the price reversed downward from the Fibonacci 123.6% level and the balance line resistance. At this point, the price has consolidated below these lines. Marlin has turned downward and is located in negative territory. The MACD line is also turning downward. The next target is 1.6228.
There remains an unclosed Monday gap. However, in this pair, price gaps can take up to a year to close.