 English
  Русский
 Bahasa Indonesia
 Bahasa Malay
 ไทย
ไทย Español
 Deutsch
 Български
 Français
 Tiếng Việt
 中文
中文 বাংলা
বাংলা हिन्दी
 Čeština
 Українська
 Română

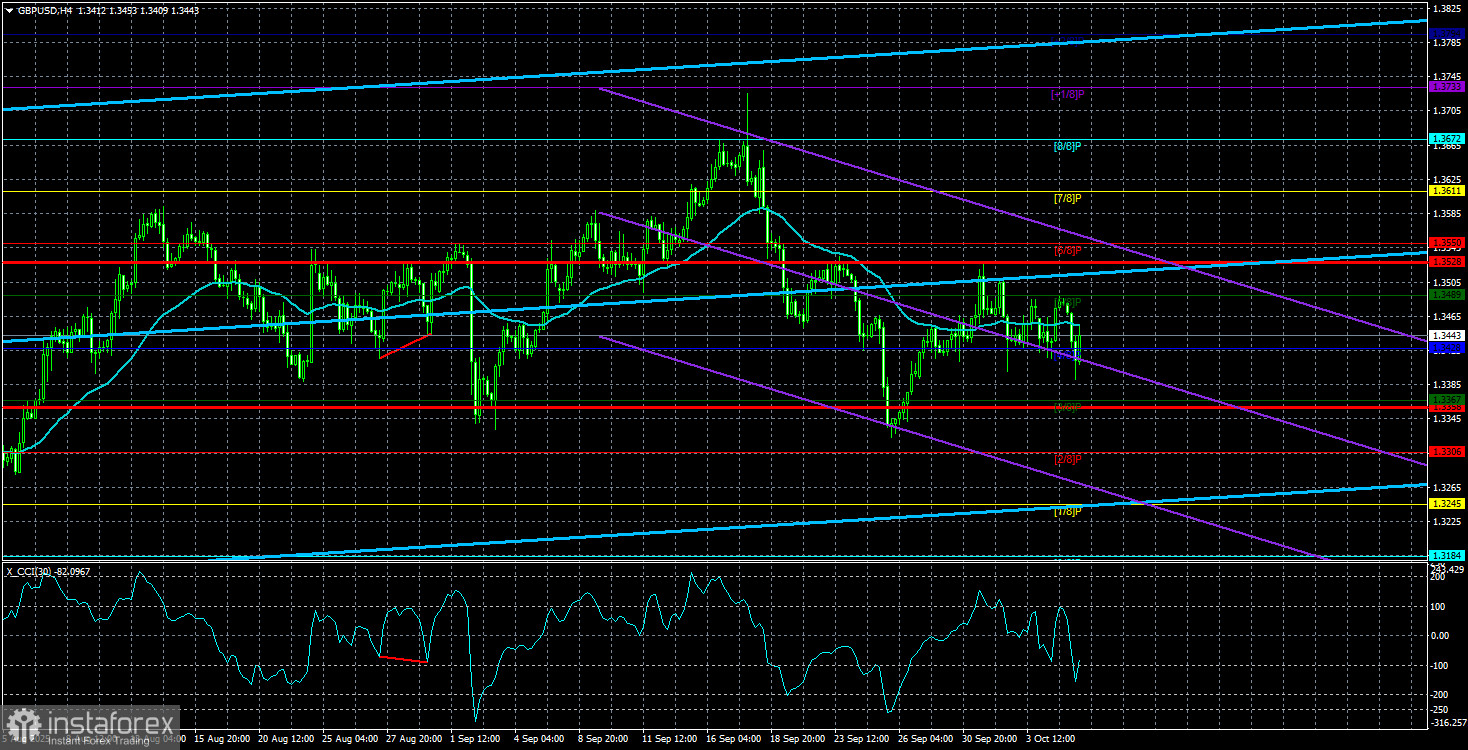
The GBP/USD currency pair continued to trade lower on Tuesday, and we continue to view this movement as entirely illogical. In the EUR/USD article, we suggested that the euro pair is in a flat range on the daily timeframe. With GBP/USD, there's really no need to guess — the flat is plain to see. Given the traditionally high correlation between the euro and pound, there's every reason to assume that both currencies are trading sideways. If true, then the current decline in the pound is purely technical and has nothing to do with macroeconomic or fundamental factors.
Even on the 4-hour chart, it's clear that the price has been bouncing around in every direction over the past month. What do such movements indicate? They suggest that the market cannot decide what to do next. And why is that? Because the market is in a range, a period used by market makers for accumulating or distributing positions.
It's essential to remember that market makers — meaning the large players who significantly influence the market — cannot simply purchase a couple of billion dollars in one trade. They need to build their position over time. And to do that, they need someone on the other side of the trade willing to sell those billions. This isn't like walking into a bank and buying $100. Flat markets are the perfect time for establishing or closing out those large positions. Prices remain relatively stable, making range-bound periods ideal.
That means trades made within a flat range by major players don't have to align with macroeconomic fundamentals at all. If a large institution needs to close a long position, it will do so. It may not be necessary to rush into opening new longs just because the U.S. has entered a shutdown. Every trader knows that once a flat ends, the market moves into a trend, which means positions have already been established, and it's time for momentum.
This is why, regardless of the short-term movements GBP/USD may currently exhibit, they have little relevance to the pair's medium-term prospects. Believing in the dollar rally right now is like waiting for aliens to solve all of humanity's problems. The dollar rose for over 16–17 years because it had solid reasons to do so. However, with central banks actively reducing their USD reserves and Donald Trump publicly stating the need for a weaker dollar, what are the chances the currency will return to parity, where it began its rise earlier this year?
And let's be clear — the dollar is not gaining strength because of Trump's vague offers to cooperate with Democrats. On Tuesday, news emerged that the U.S. president may extend healthcare and social programs — the very ones he had previously curtailed with his "one big, beautiful bill." If this update is considered more important than the weakening U.S. labor market, the Federal Reserve's dovish tone, or the tightening global interest rate gap, it's not. It's a spoonful of honey in a barrel of tar, and the dollar has now been simmering in that barrel for nine months.
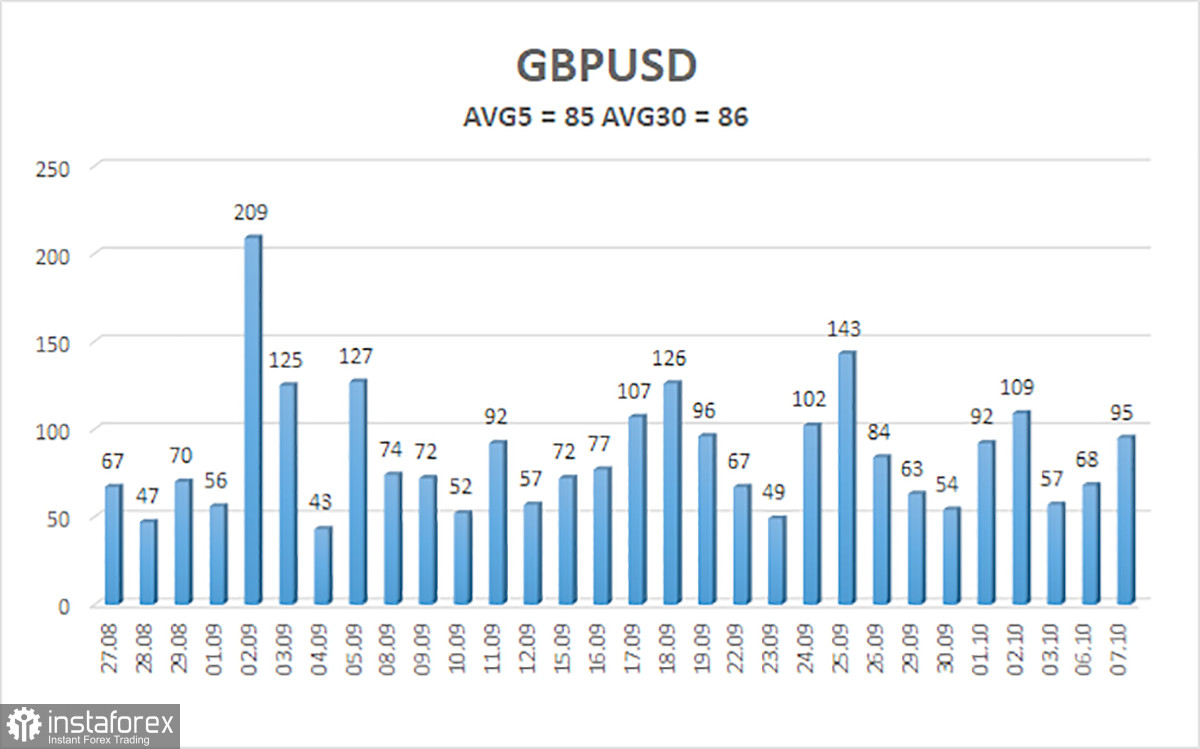
As of October 8, the average volatility of the GBP/USD pair over the past five trading days stands at 85 pips. This is considered moderate for this pair. On Wednesday, we expect movement within a range defined by 1.3358 and 1.3528. The higher linear regression channel is pointed upward, which still supports the broader upward trend. The CCI indicator recently entered oversold territory again, warning of a possible trend reversal to the upside.
Nearest Support Levels:
S1 – 1.3428
S2 – 1.3367
S3 – 1.3306
Nearest Resistance Levels:
R1 – 1.3489
R2 – 1.3550
R3 – 1.3611
Trading Recommendations:
The GBP/USD currency pair is currently undergoing a correction, but its long-term outlook remains unchanged. Donald Trump's policy approach will continue to put pressure on the dollar, so we do not expect sustained dollar strength.
Consequently, long positions with targets at 1.3672 and 1.3733 remain much more appropriate as long as the price holds above the moving average. If the price dips below the moving average, small short positions may be considered, with targets at 1.3367 and 1.3358 on a purely technical basis.
The U.S. dollar does show occasional corrective strength, like now, but for a true upward trend to resume, it would require clear signs that the trade war is ending — or other major global positive developments in favor of the greenback.
Chart Annotations:
- Linear regression channels help determine the current market trend. If both channels are aligned in the same direction, the trend is considered strong.
- The 20-period smoothed moving average defines the short-term trend direction and determines the preferred trade action.
- Murrey levels are used to set price targets for both trending and corrective phases.
- Volatility levels (marked with red lines) outline the likely price range for the next 24 hours based on recent volatility metrics.
- CCI (Commodity Channel Index): Readings below -250 or above +250 signal potential trend reversals.