 English
  Русский
 Bahasa Indonesia
 Bahasa Malay
 ไทย
ไทย Español
 Deutsch
 Български
 Français
 Tiếng Việt
 中文
中文 বাংলা
বাংলা हिन्दी
 Čeština
 Українська
 Română

On the weekly chart, the price is trying to push through the support of the MACD line. This line has been broken several times in the past (marked by green arrows), but each time the price quickly rebounded as there was no weekly close below it.
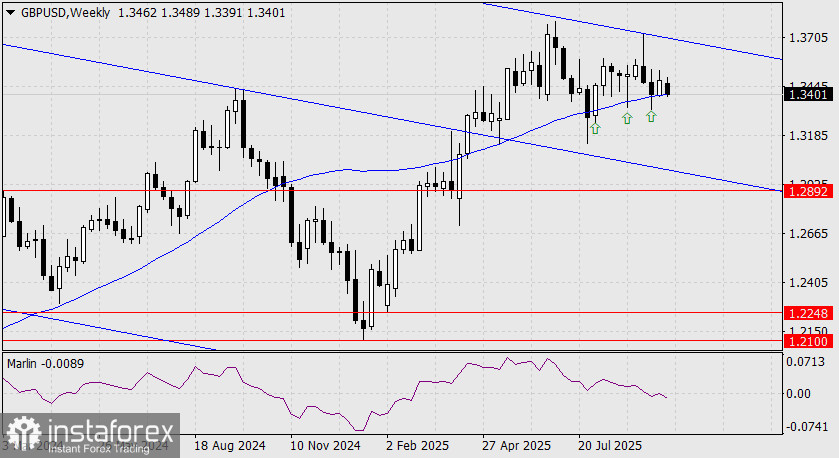
The same may happen now — if the next weekly candle does not close below the current level of 1.3400, then a breakout into a medium-term downtrend is unlikely. However, the probability of a true breakout is significantly higher this time compared to previous attempts, because back then the Marlin oscillator remained in positive territory, whereas now it is situated in negative territory.
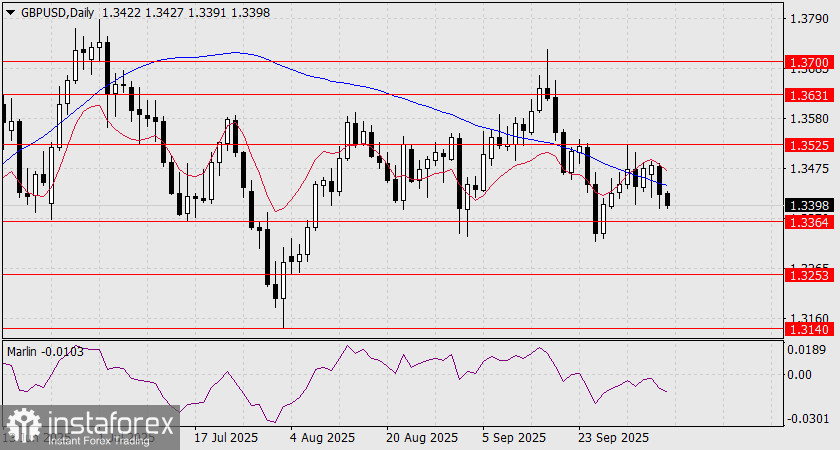
On the daily chart, the price has moved below the MACD line. The nearest target level at 1.3364 is now within range. A firm close below this level would open the path toward the next downside target at 1.3253. If the pair fails to hold below this level, we may see a repeat of the September 25th scenario, when the weekly candle pierced below the line but failed to confirm the breakout.
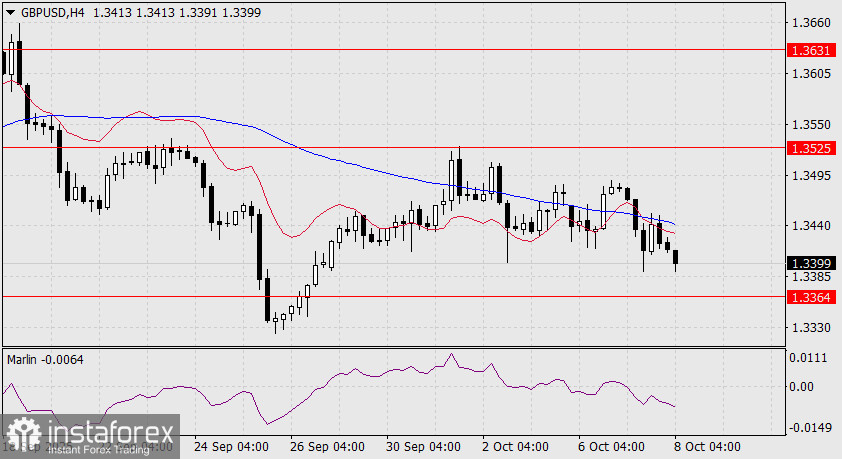
On the H4 chart, the price has consolidated below both indicator lines, and the Marlin oscillator continues to descend further in negative territory. If the price on this timeframe firmly holds below the 1.3364 level, this would be the first solid signal of the pair's intent to continue its decline toward 1.3253.