 English
  Русский
 Bahasa Indonesia
 Bahasa Malay
 ไทย
ไทย Español
 Deutsch
 Български
 Français
 Tiếng Việt
 中文
中文 বাংলা
বাংলা हिन्दी
 Čeština
 Українська
 Română

Tuesday Trade Review
1-Hour EUR/USD Chart
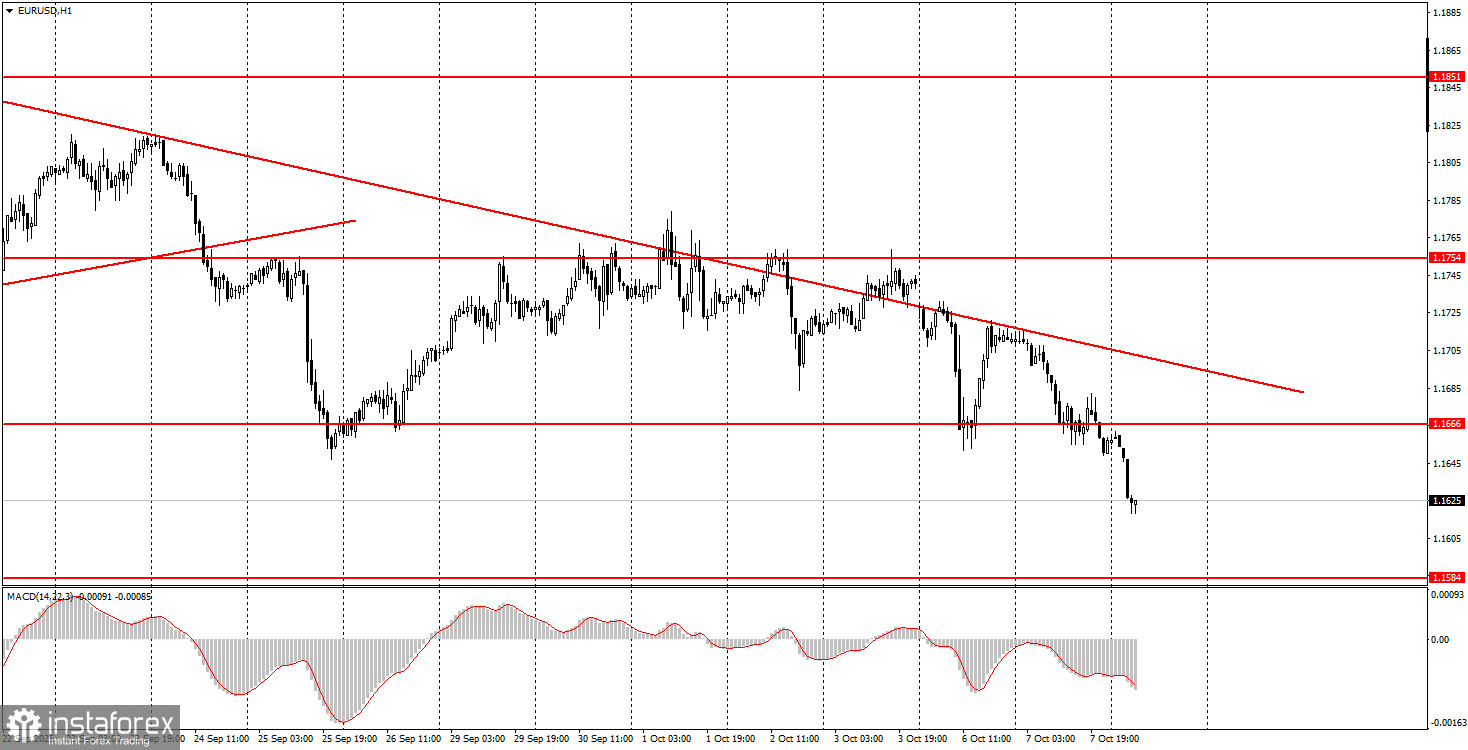
On Tuesday, the EUR/USD currency pair continued falling despite an entirely empty macroeconomic calendar. The U.S. dollar, which had declined throughout 2025, is now unexpectedly rising — and many analysts are scrambling to find explanations for this move. There are no convincing arguments in favor of dollar strength this week. Last week, the dollar at least moved sideways, although even that didn't make sense considering the weak overall macro and fundamental backdrop. To recap: ISM business activity indexes came in weak, U.S. employment data disappointed again, and a government shutdown began in the U.S.
We believe there are three compelling reasons to sell the dollar promptly. Yet the market seems determined to interpret the situation differently. We consider the current market move to be illogical, and we say this openly. In our view, it is pointless to pin this move on France's political instability — especially since the British pound, which has no direct connection to France's Prime Minister resigning, is also in decline.
5-Minute EUR/USD Chart
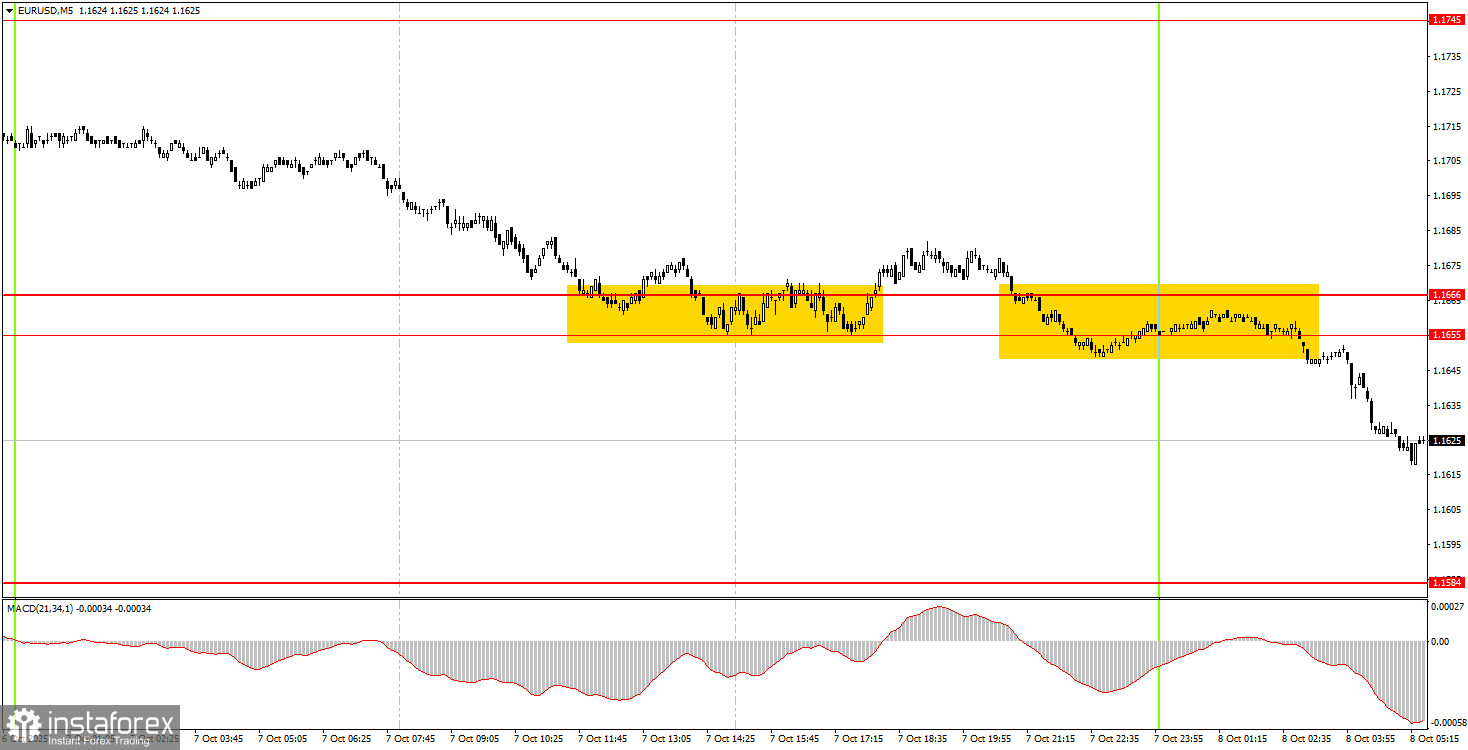
On the 5-minute chart, current movements are not logical either. It's essential to recognize that illogical moves are relatively easy to identify. The price seems to disregard key levels altogether. For instance, the pair did technically bounce from the 1.1655–1.1666 area yesterday, which had previously acted as strong support multiple times. But this time, it failed to provide any resistance. Overnight, the dollar kept rising — and there's absolutely no real reason for this.
How to Trade on Wednesday
On the hourly chart, EUR/USD has broken the trendline multiple times, indicating a formal trend reversal to the upside. The overall macro and fundamental backdrop remains weak for the U.S. dollar, so we do not expect any strong or sustained bullish momentum for the greenback. We continue to believe current movements are merely technical corrections — and this appears to be one of them. Even if the downtrend continues, we won't consider it fundamentally justified.
On Wednesday, the EUR/USD could continue to decline now that the 1.1655–1.1666 zone has been breached. We maintain that this move is not aligned with logic, and the price is increasingly ignoring support and resistance levels. Surprises are possible.
On the 5-minute chart, pay attention to the following key levels: 1.1354–1.1363, 1.1413, 1.1455–1.1474, 1.1527, 1.1571–1.1584, 1.1655–1.1666, 1.1745–1.1754, 1.1808, 1.1851, 1.1908, 1.1970–1.1988.
On Wednesday, European Central Bank President Christine Lagarde will deliver another speech in the Eurozone. This will be her third appearance this week, and so far, none of her speeches has delivered any significant insights. In the evening, the Federal Reserve will publish its latest meeting minutes, which are typically viewed as procedural and unlikely to have a significant impact on markets.
Core Rules of the Trading System:
- The strength of a trading signal is based on how quickly it forms (either a bounce or a breakout). The less time required, the stronger the signal.
- If two or more trades from a specific level turn out to be false signals, all future signals from that level should be ignored.
- In a flat (sideways) market, many false signals may emerge, or no signals at all. In any case, if sideways conditions are detected, it's better to stop trading.
- Trades should be entered between the start of the European session and the middle of the American session. All open trades should be closed manually afterward.
- On the hourly chart, MACD-based signals should only be followed when volatility is high and a trendline or trend channel confirms a trend.
- If two levels are too close to one another (between 5 and 20 pips), they should be treated as a single support or resistance zone.
- Once a trade moves 15 pips in your favor, the Stop Loss should be set to breakeven.
Interpretation of Chart Elements:
- Support and resistance levels are the key targets for opening buy or sell positions. Take Profit levels can also be set around them.
- Red lines indicate channels or trendlines that represent the current market direction and the preferred trading vector.
- The MACD (14, 22, 3) histogram and signal lines are auxiliary indicators used to generate entry signals.
Final Notes for Beginners:
Major speeches and reports (always listed in economic calendars) can heavily affect currency pair movements. It's best to trade cautiously or stay out of the market during such events to avoid sudden reversals.
Beginner forex traders should always remember that not every trade will be profitable. Developing a clear trading strategy and sound money management are the cornerstones of long-term success.