 English
  Русский
 Bahasa Indonesia
 Bahasa Malay
 ไทย
ไทย Español
 Deutsch
 Български
 Français
 Tiếng Việt
 中文
中文 বাংলা
বাংলা हिन्दी
 Čeština
 Українська
 Română

Tuesday's Trade Review
1-Hour GBP/USD Chart
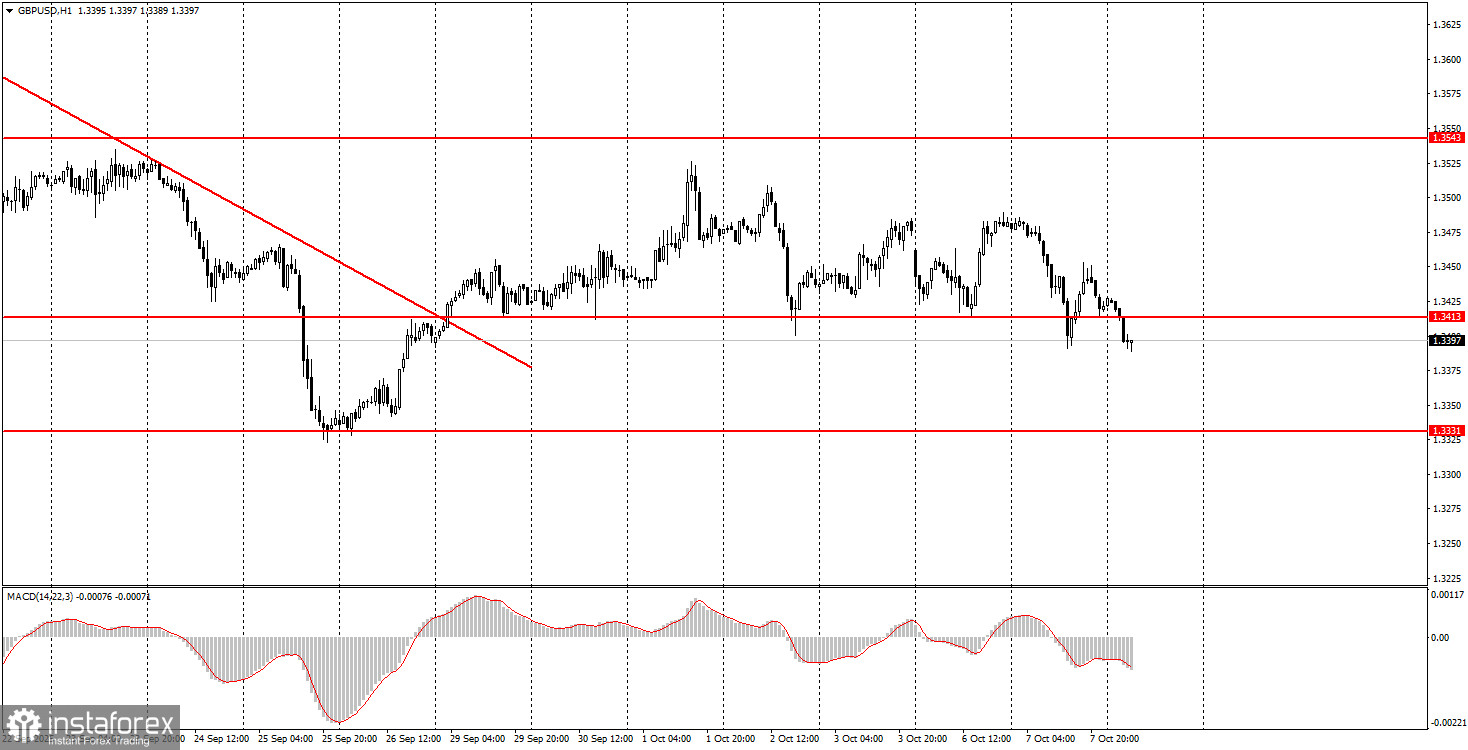
On both Tuesday and Wednesday, the GBP/USD currency pair continued to move downward, with no apparent reason for this decline. Many analysts have attributed the strength of the dollar to the political crisis in France. However, that doesn't explain why the British pound is falling too. Could it be that it's the dollar rising?
However, let's recall that on Monday and Tuesday, no significant U.S. events occurred, and the U.S. Senate failed for the fifth time to pass a budget for the upcoming fiscal year. Is that reason enough for the dollar to rise? Because the government shutdown continues?
That's why we consider this movement completely illogical. The only plausible explanation is that the pair is trading in a flat range on the daily timeframe. If traders switch to that chart, they'll notice that the pound has been moving sideways for several months — more so than upwards — although the general uptrend of 2025 remains intact. In range-bound markets, significant fundamental or macroeconomic drivers are not necessary. Thus, the recent drop in the pair may be purely technical.
5-Minute GBP/USD Chart
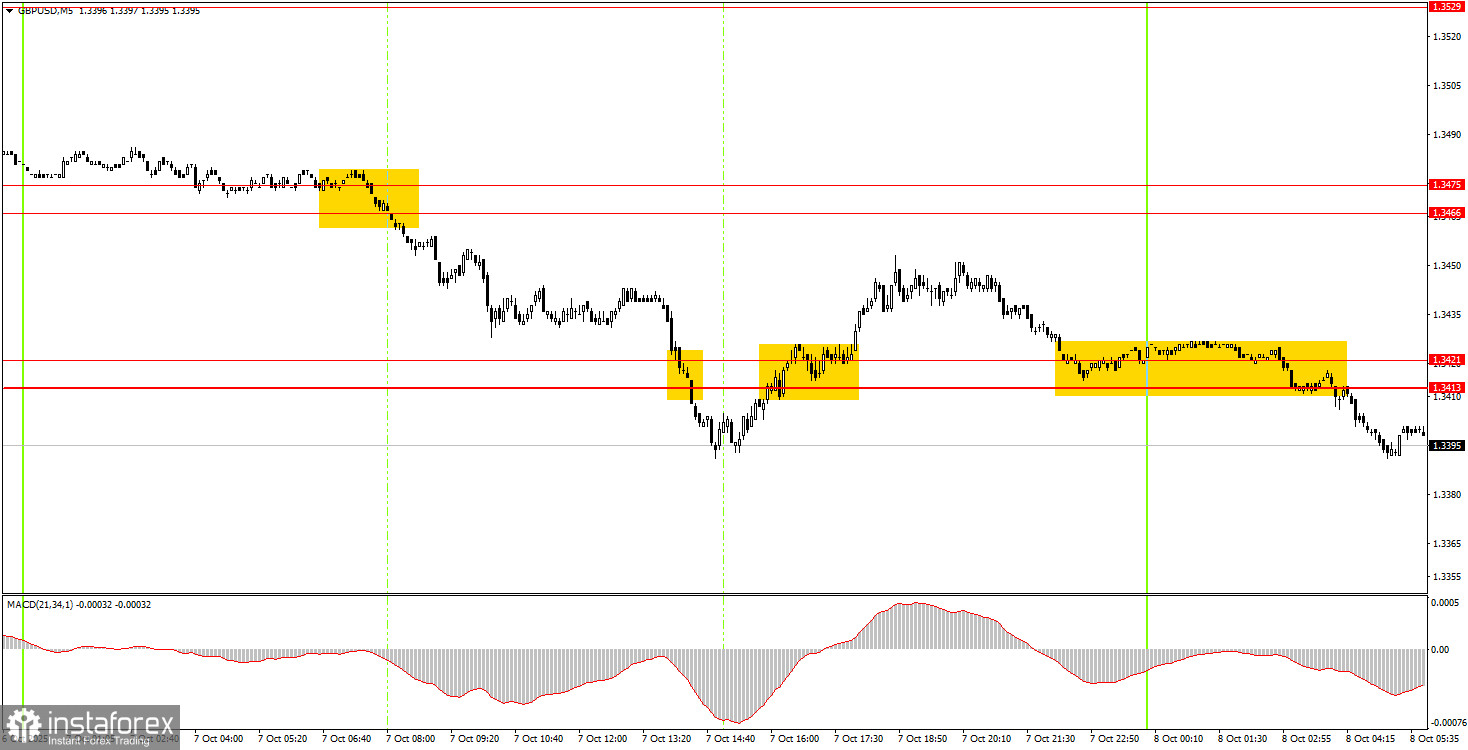
On the 5-minute chart, the pattern is quite similar to what we're seeing in EUR/USD. The price has begun to ignore support and resistance levels. For example, the 1.3413 level held the price from falling further three times — and this despite a lack of any compelling news or events supporting a bearish move. Yet yesterday, the price broke below this level and consolidated beneath it overnight.
It creates the impression that market makers are deliberately pushing prices lower. Nonetheless, the trading signals were fairly decent. Short positions could have been opened after the price had consolidated below the 1.3466–1.3475 range. Once the price moved back above 1.3413–1.3421, those shorts could have been closed. During the night, new short positions were possible — assuming you were awake and trading at that time.
How to Trade on Wednesday
On the hourly chart, GBP/USD has completed the formation of a downside movement. As previously mentioned, there are no substantial reasons to expect prolonged dollar strength. That's why, in the medium term, we anticipate upward movement (north). However, the current market remains in a strange state. The British pound continues to fall — but there's no solid explanation behind it. You can still trade technically on the lower timeframes, but the price movements remain illogical at almost every timeframe.
On Wednesday, the GBP/USD pair may continue moving downward, particularly after breaking below the 1.3413–1.3421 zone overnight. However, the current movement style is highly unstable, so upside corrections remain possible without clear justification. Moreover, the price is now beginning to ignore key levels and zones.
On the 5-minute chart, you can currently trade using the following levels: 1.3102–1.3107, 1.3203–1.3211, 1.3259, 1.3329–1.3331, 1.3413–1.3421, 1.3466–1.3475, 1.3529–1.3543, 1.3574–1.3590, 1.3643–1.3652, 1.3682, 1.3763.
There are no significant reports or economic events scheduled in either the U.S. or the U.K. for Wednesday. The only item worth noting is the release of the Federal Reserve meeting minutes in the evening, which is primarily considered a procedural document without major market impact.
Core Rules of the Trading System:
- The strength of a trading signal is based on how quickly it forms (either a bounce or a breakout). The less time required, the stronger the signal.
- If two or more trades from a specific level turn out to be false signals, all future signals from that level should be ignored.
- In a flat (sideways) market, many false signals may emerge, or no signals at all. In any case, if sideways conditions are detected, it's better to stop trading.
- Trades should be entered between the start of the European session and the middle of the American session. All open trades should be closed manually afterward.
- On the hourly chart, MACD-based signals should only be followed when volatility is high and a trendline or trend channel confirms a trend.
- If two levels are too close to one another (between 5 and 20 pips), they should be treated as a single support or resistance zone.
- Once a trade moves 20 pips in your favor, the Stop Loss should be set to breakeven.
Interpretation of Chart Elements:
- Support and resistance levels are the key targets for opening buy or sell positions. Take Profit levels can also be set around them.
- Red lines indicate channels or trendlines that represent the current market direction and the preferred trading vector.
- The MACD (14, 22, 3) histogram and signal lines are auxiliary indicators used to generate entry signals.
Final Notes for Beginners:
Major speeches and reports (always listed in economic calendars) can heavily affect currency pair movements. It's best to trade cautiously or stay out of the market during such events to avoid sudden reversals.
Beginner forex traders should always remember that not every trade will be profitable. Developing a clear trading strategy and sound money management are the cornerstones of long-term success.