 English
  Русский
 Bahasa Indonesia
 Bahasa Malay
 ไทย
ไทย Español
 Deutsch
 Български
 Français
 Tiếng Việt
 中文
中文 বাংলা
বাংলা हिन्दी
 Čeština
 Українська
 Română

On Thursday, the EUR/USD pair rebounded from the resistance level of 1.1645 – 1.1666, reversed in favor of the US dollar, and continued the downward move that has been observed in recent weeks. Consolidation below the 61.8% Fibonacci level at 1.1594 allows us to expect further decline toward the next corrective level at 76.4% – 1.1517. A consolidation above 1.1594 would favor the euro and open the way for growth toward the 1.1645 – 1.1656 level.
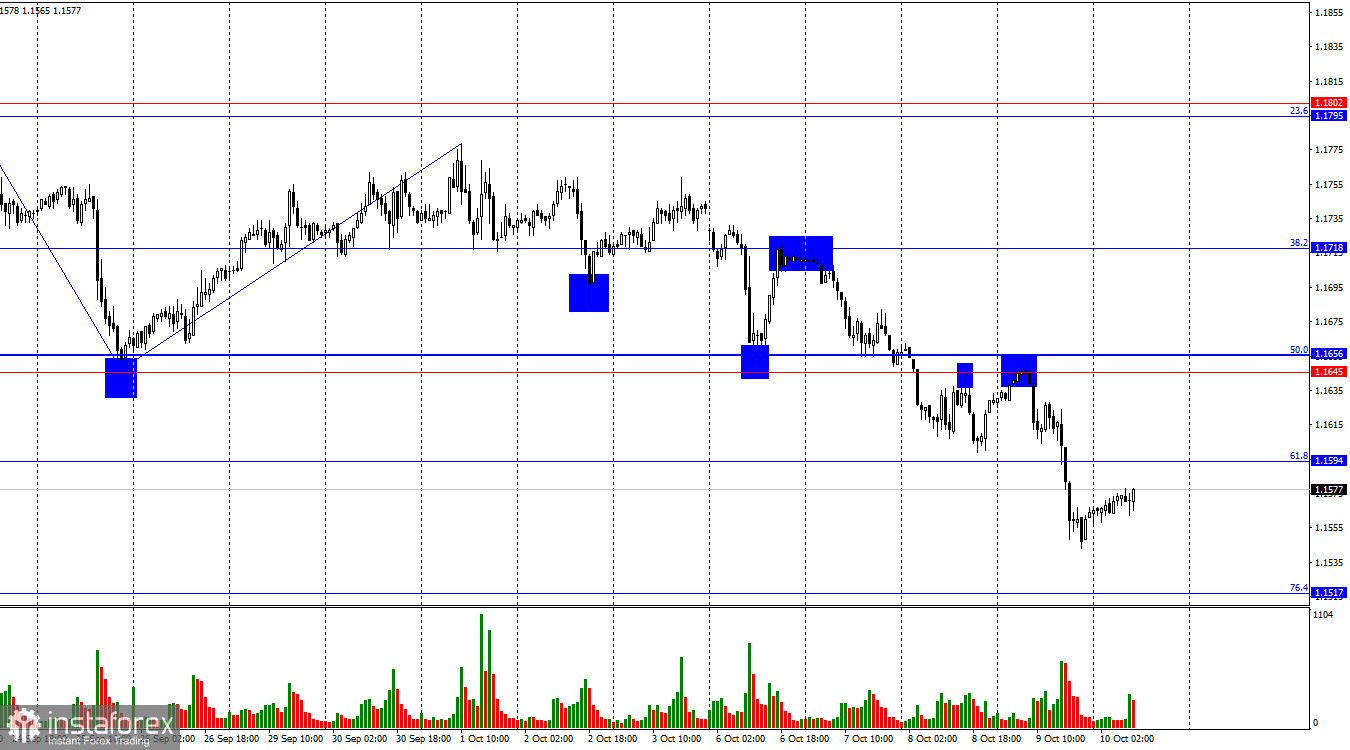
The wave situation on the hourly chart remains simple and clear. The last completed upward wave did not break the peak of the previous wave, while the new downward wave broke the previous low. Thus, the trend currently remains bearish. However, the latest labor market data and changing Fed monetary policy prospects support the bulls, which is why I expect the trend to shift to bullish. For the bearish trend to end, the price must consolidate above the last peak at 1.1779.
On Thursday evening, Jerome Powell gave his much-anticipated speech. Looking at the market's reaction, it became immediately clear that Powell's tone was either "hawkish" or less "dovish" than traders expected. The dollar strengthened significantly. Since there is no talk of a Fed rate hike at this time, the only assumption left is that traders expected Powell to promise two rounds of monetary easing by year-end – but did not hear it.
Thus, the dollar is rising not because the Fed is taking a hawkish stance, but because the market expects more dovish actions from the Fed, which are not being confirmed in practice. The FOMC maintains its previous stance regardless of the circumstances. The lack of inflation, unemployment, and job creation data does not change the strategy: first the data, then the decision. Therefore, the dollar continues to grow – but I still believe this growth will end very soon. The dollar has already risen strongly, and there are not many factors left to support its continued advance.
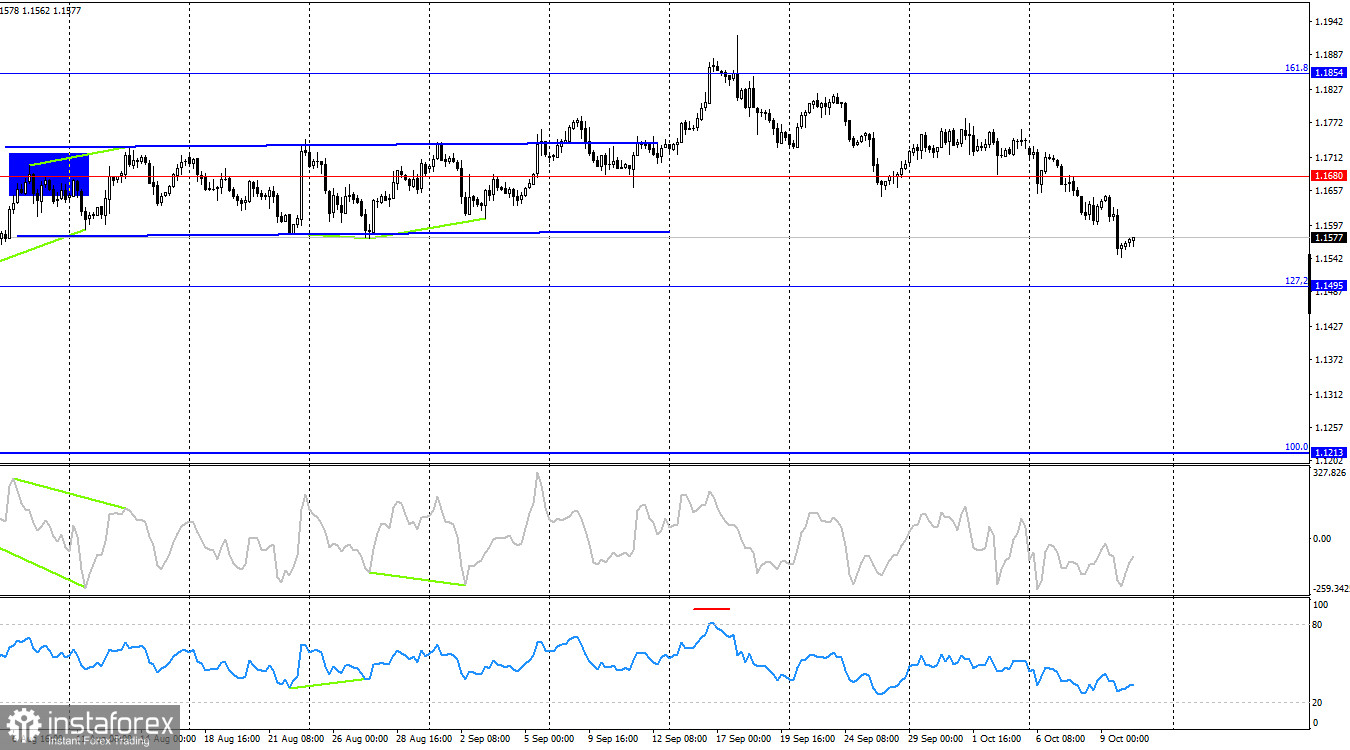
On the 4-hour chart, the pair consolidated below 1.1680, which allows traders to expect a further decline toward the 127.2% corrective level at 1.1495. The CCI indicator shows signs of a bullish divergence, which could stop the current fall. A close above 1.1680 would favor the euro and a return to a bullish trend toward the 161.8% corrective level at 1.1854.
Commitments of Traders (COT) Report:
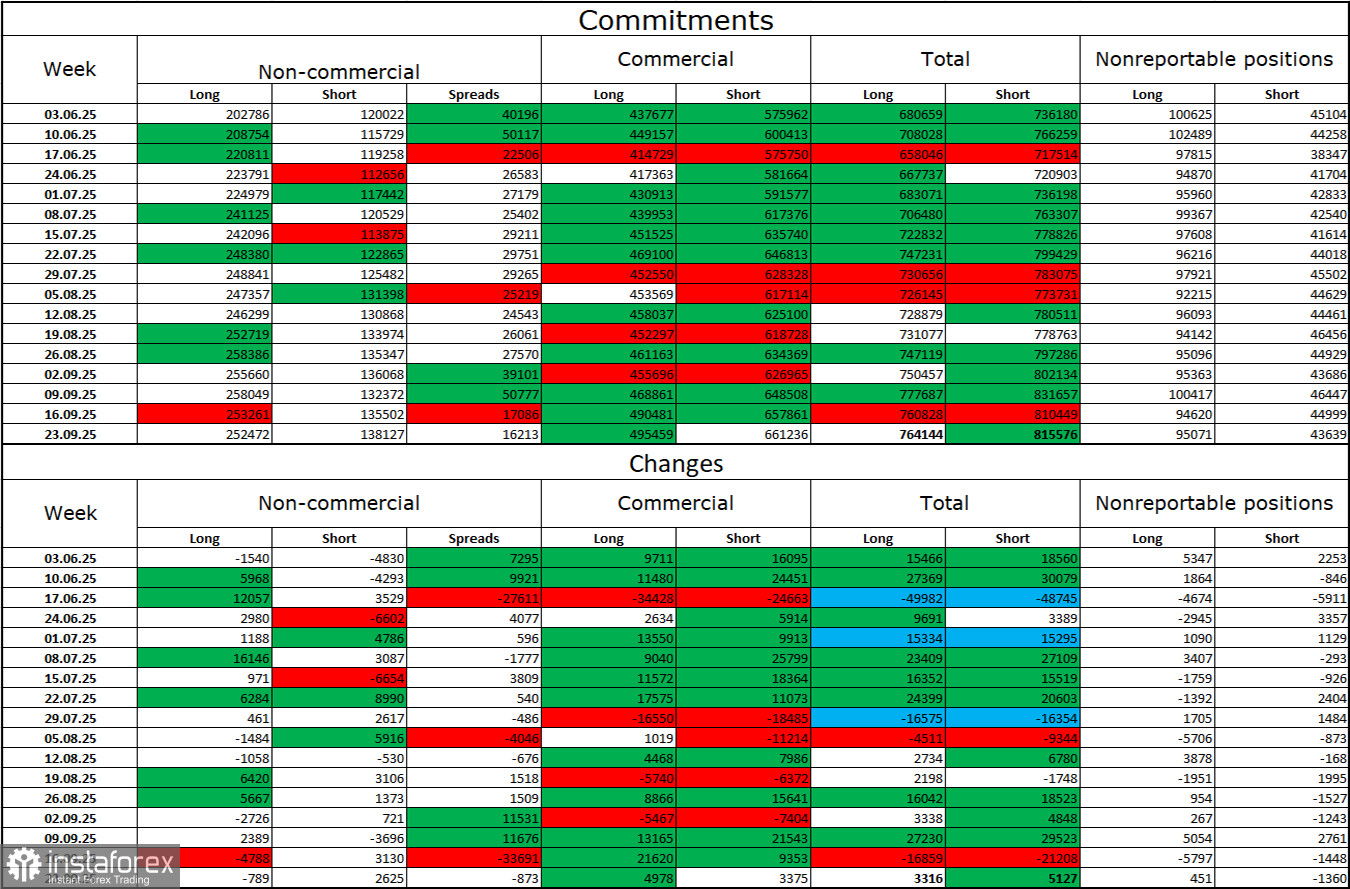
Over the last reporting week, professional players closed 789 long positions and opened 2,625 short positions. The sentiment of the Non-commercial group remains bullish thanks to Donald Trump and continues to strengthen over time. The total number of long positions held by speculators is now 252,000, while short positions stand at 138,000 – nearly a two-to-one ratio.
Note also the large number of green cells in the table above, indicating strong accumulation of long positions in the euro. In most cases, interest in the euro continues to rise, while interest in the dollar declines.
For 33 consecutive weeks, large players have been reducing shorts and adding longs. Donald Trump's policies remain the most significant factor for traders, as they can cause numerous long-term, structural problems for the US. Despite the signing of several important trade agreements, many key economic indicators are showing declines.
News Calendar for the US and EU:
- US – University of Michigan Consumer Sentiment Index (14:00 UTC).
On October 10, the economic calendar contains just one entry. The influence of the news background on market sentiment on Friday may be weak.
EUR/USD Forecast and Trading Tips:
Sales were possible earlier on a rebound from the 1.1718 level on the hourly chart. The support level 1.1645 – 1.1656 has been broken, so short positions could be held with a target of 1.1594. Today, short trades can remain open with a target of 1.1517, moving Stop Loss to breakeven. Longs can be considered on a rebound from 1.1517 or on a close above 1.1594.
Fibonacci grids are built from 1.1392 – 1.1919 on the hourly chart and from 1.1214 – 1.0179 on the 4-hour chart.