 English
  Русский
 Bahasa Indonesia
 Bahasa Malay
 ไทย
ไทย Español
 Deutsch
 Български
 Français
 Tiếng Việt
 中文
中文 বাংলা
বাংলা हिन्दी
 Čeština
 Українська
 Română

Trade Review for Wednesday:
1-Hour EUR/USD Chart
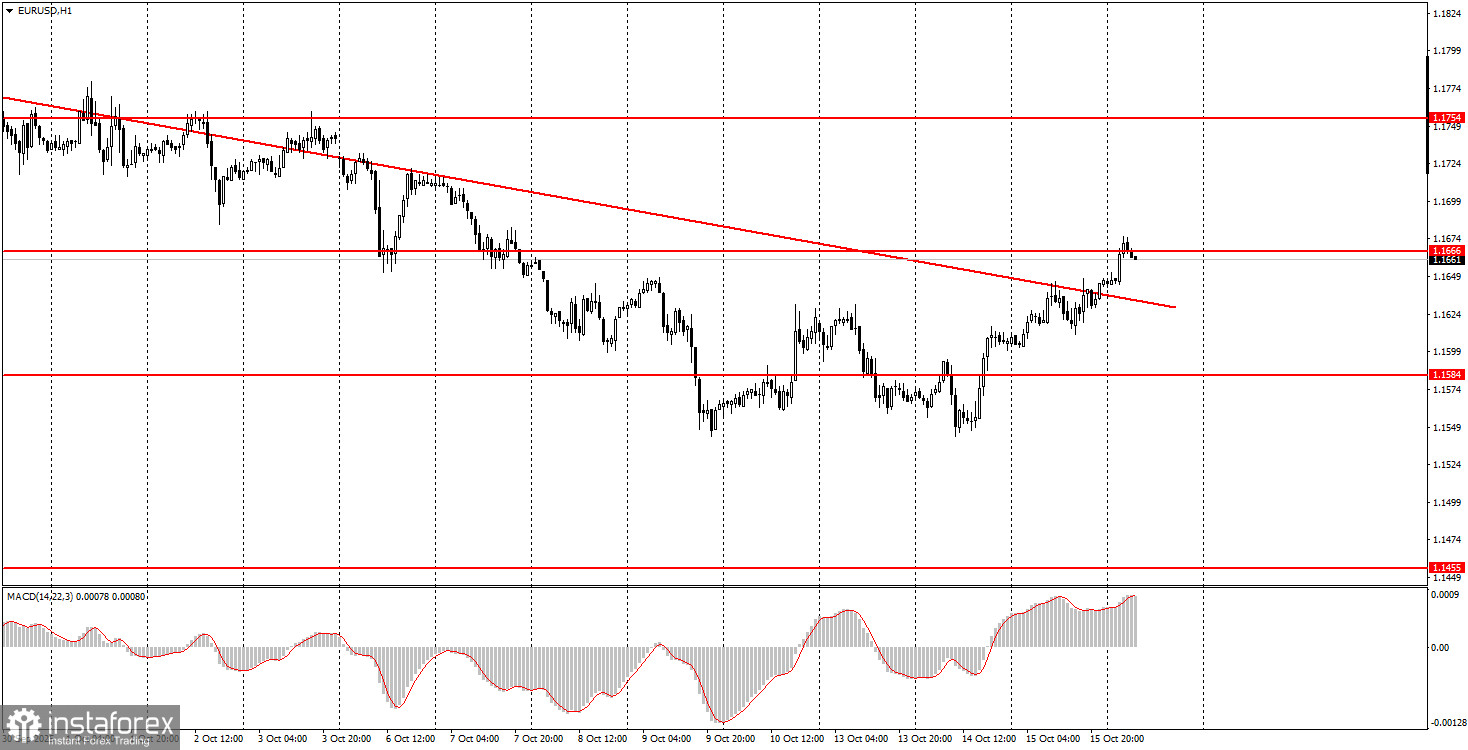
On Wednesday, the EUR/USD currency pair continued its upward movement. Among notable events that day were the ongoing deterioration in U.S.–China relations and the Eurozone's industrial production report, which, despite coming in weak, still exceeded expectations—possibly contributing to minor euro strength. Overall, the market finally began buying the euro, which is a positive development. The descending trendline was breached again, suggesting the formation of at least a short-term bullish trend. As mentioned previously, we continue to expect the EUR/USD pair to rise and believe the 2025 uptrend will ultimately resume. Over the past several weeks, the market has ignored numerous bearish signals concerning the U.S. dollar. Now, it's time for them to be priced in.
5-Minute EUR/USD Chart
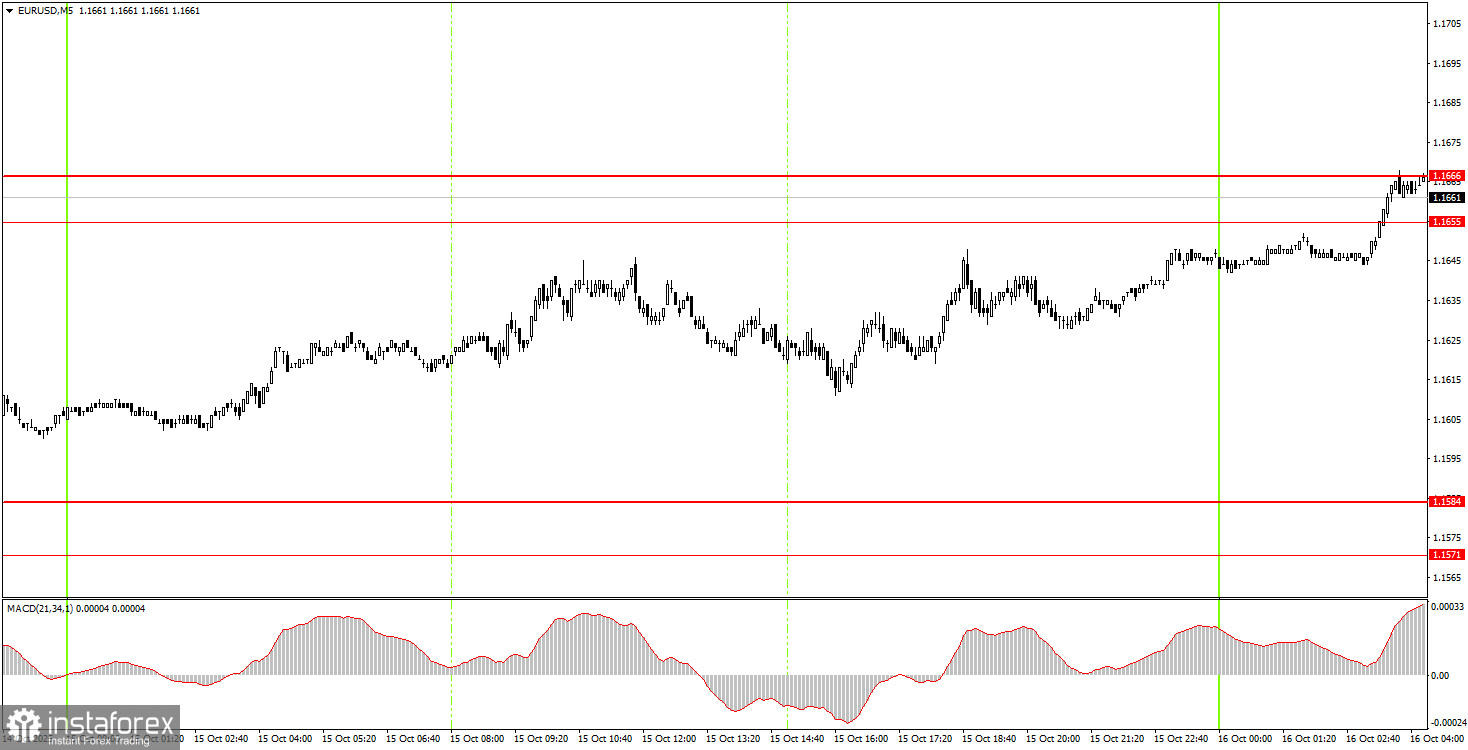
The 5-minute timeframe did not generate any new trading signals on Wednesday. However, a strong buy signal—breaking through the 1.1571–1.1584 zone—was formed Tuesday evening. It was previously suggested to move the Stop Loss to breakeven and keep the trade open. As seen, the target was eventually reached.
How to Trade on Thursday:
On the hourly chart, the EUR/USD pair is now showing signs of a reversal to the upside. The descending trendline has been broken once again, and the overall fundamental and macroeconomic outlook remains weak for the U.S. dollar. Therefore, we continue to anticipate a resumption of the 2025 uptrend.
On Thursday, the EUR/USD pair may move in either direction, as fundamental and macroeconomic events are limited. However, beginner traders now have a new decision zone—1.1655–1.1666. A consolidation above this area allows for long positions with a target at 1.1745, while a drop below it opens the door for short positions targeting 1.1584.
On the 5-minute TF, consider the levels 1.1354-1.1363, 1.1413, 1.1455-1.1474, 1.1527, 1.1571-1.1584, 1.1655-1.1666, 1.1745-1.1754, 1.1808, 1.1851, 1.1908, 1.1970-1.1988. For Thursday, the only event listed on the Eurozone calendar is a speech by ECB President Christine Lagarde. Apart from that, no other significant events are expected. Therefore, volatility may remain low, and the euro could continue rising on technical grounds.
Core Rules of the Trading System:
- Signal strength is judged by the time required for signal formation (bounce or breakout). The quicker the formation, the stronger the signal.
- If two or more false trades were opened at a level, any subsequent signals from that level should be ignored.
- In flat markets, currency pairs may produce numerous false signals or none at all. It's best to stop trading at the first signs of a flat.
- Trades should be opened during the European session through the midpoint of the U.S. session. All trades should be manually closed afterward.
- On the hourly chart, MACD signals should only be used when good volatility and a clear trend are confirmed with a trendline or channel.
- If two levels are too close to each other (within 5 to 20 pips), they should be considered a support/resistance zone.
- After 15 pips of movement in the correct direction, set the Stop Loss at breakeven.
Chart Annotations:
- Support/resistance levels: key targets for opening buy/sell trades. Take Profit levels can also be set near them.
- Red lines: trendlines or channels indicating the current trend and preferred trade direction.
- MACD (14,22,3): histogram and signal line, used as an auxiliary signal generator.
Important Note:
Key speeches and economic reports (always available in the news calendar) can significantly affect currency pair movements. During such events, trade with extreme caution or exit the market to avoid sudden reversals against the prior trend.
Reminder for Beginners:
No trade is guaranteed to be profitable. The key to long-term success in forex trading is to develop a clear strategy and apply sound money management principles.