 English
  Русский
 Bahasa Indonesia
 Bahasa Malay
 ไทย
ไทย Español
 Deutsch
 Български
 Français
 Tiếng Việt
 中文
中文 বাংলা
বাংলা हिन्दी
 Čeština
 Українська
 Română

On the hourly chart, the GBP/USD pair on Thursday rebounded from the resistance level of 1.3354–1.3357 and declined toward the 23.6% Fibonacci retracement level at 1.3313. A rebound from the 1.3313 level today would favor the pound and suggest some growth toward 1.3354 and 1.3387. A consolidation of the pair's rate below 1.3313 would increase the likelihood of a continued decline toward the 0.0% Fibonacci level at 1.3247, which would likely signal the end of the bullish trend.
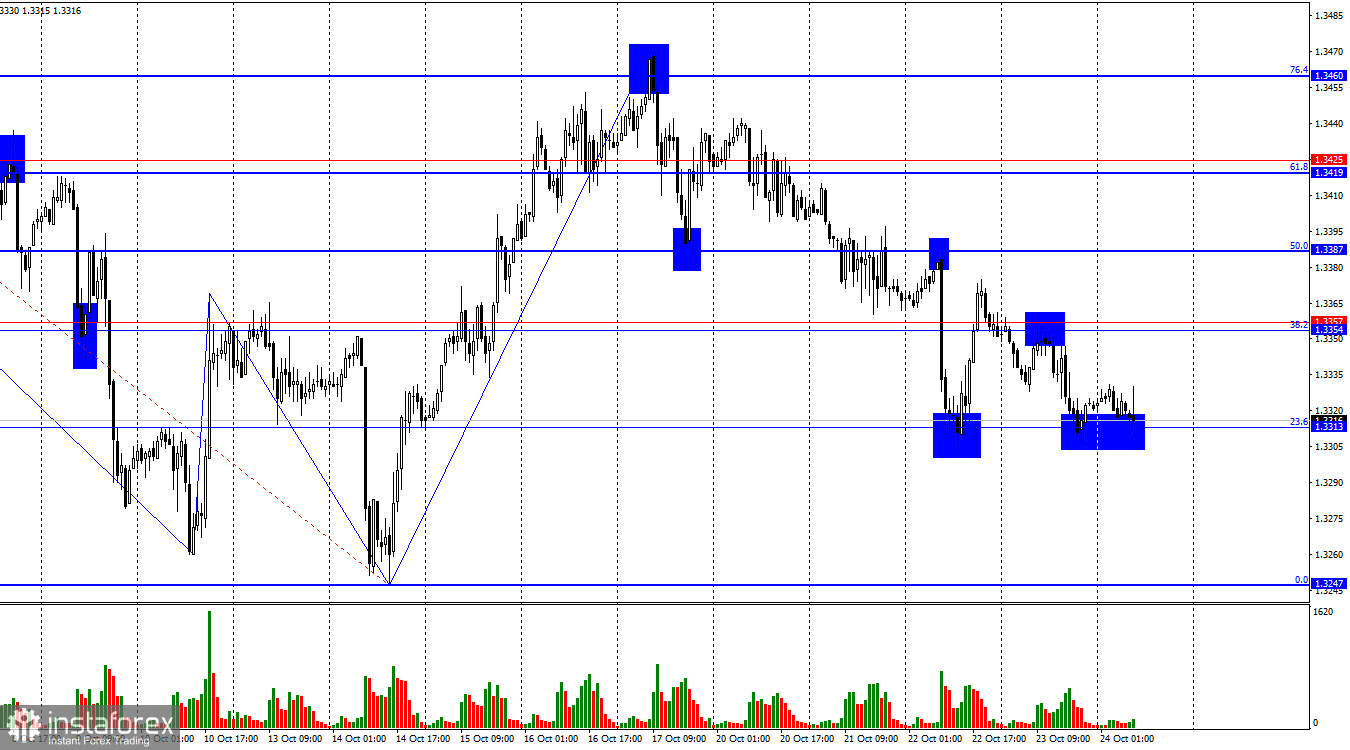
The wave pattern remains bullish. The last completed downward wave broke the previous low, but the most recent upward wave also broke the previous high. In recent weeks, the fundamental background has been negative for the U.S. dollar, yet bullish traders have not taken advantage of the opportunities for an advance. Now, they are beginning to spread their wings — but very slowly and cautiously.
On Wednesday morning, the U.K. released its September inflation report, which brought some life back into the market. Today, the U.S. inflation report will be published — which may cause market turbulence for the second time this week. To recap, U.K. inflation remained unchanged in September, while traders expect U.S. inflation to rise to 3.1%. If the Consumer Price Index (CPI) for September increases from the current 2.9%, the Federal Reserve is still expected to decide next week to cut interest rates — a decision that is effectively already made and could only be reconsidered if inflation shows a sharp jump.
However, in the longer term, a faster rise in consumer prices could influence the FOMC's plans. The longer and stronger inflation grows, the sooner the U.S. regulator will likely end its current cycle of monetary easing. Thus, higher-than-expected inflation could support the bulls today. Still, business activity indices should not be overlooked.
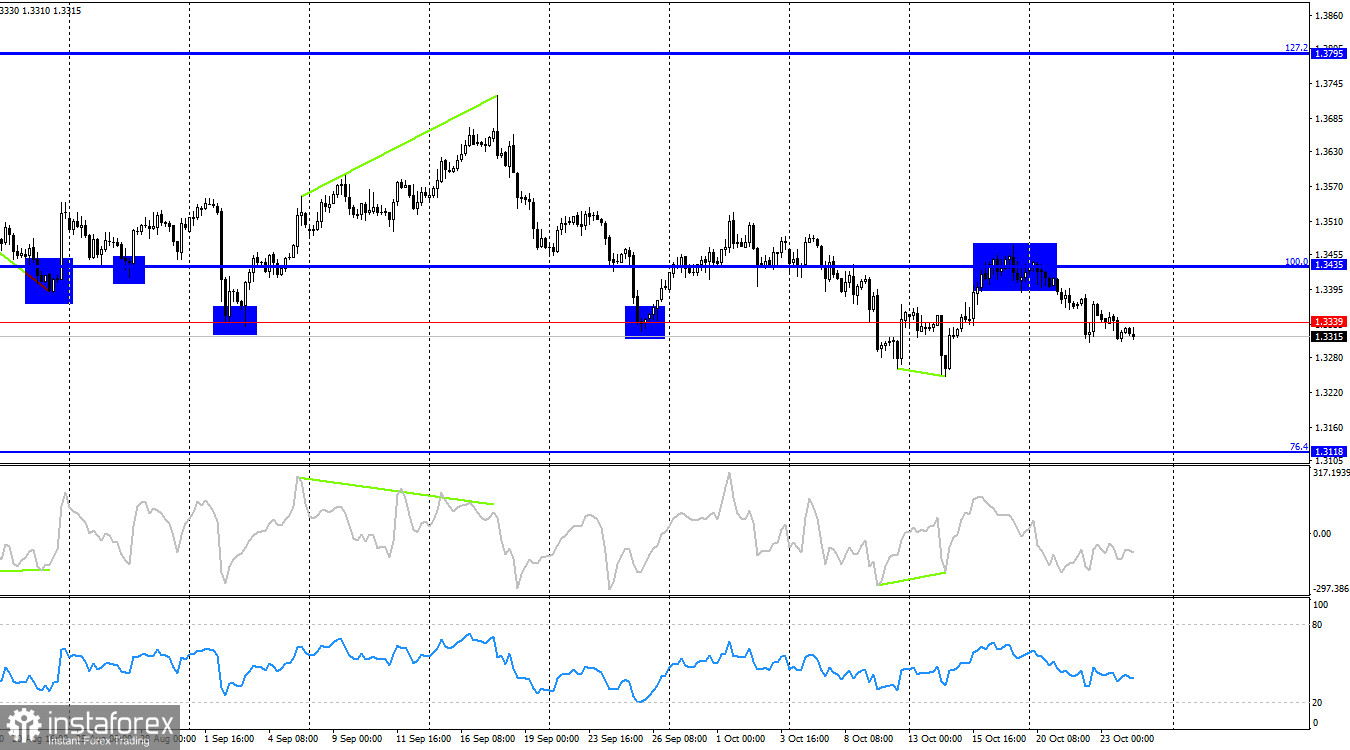
On the 4-hour chart, the pair reversed in favor of the pound after forming a bullish divergence on the CCI indicator, followed by growth toward the 100.0% retracement level at 1.3435. A rebound from this level worked in favor of the U.S. dollar and a new decline toward 1.3339. Currently, there are no new emerging divergences on any indicator. Therefore, more attention should be paid to the hourly chart for analysis.
Commitments of Traders (COT) Report
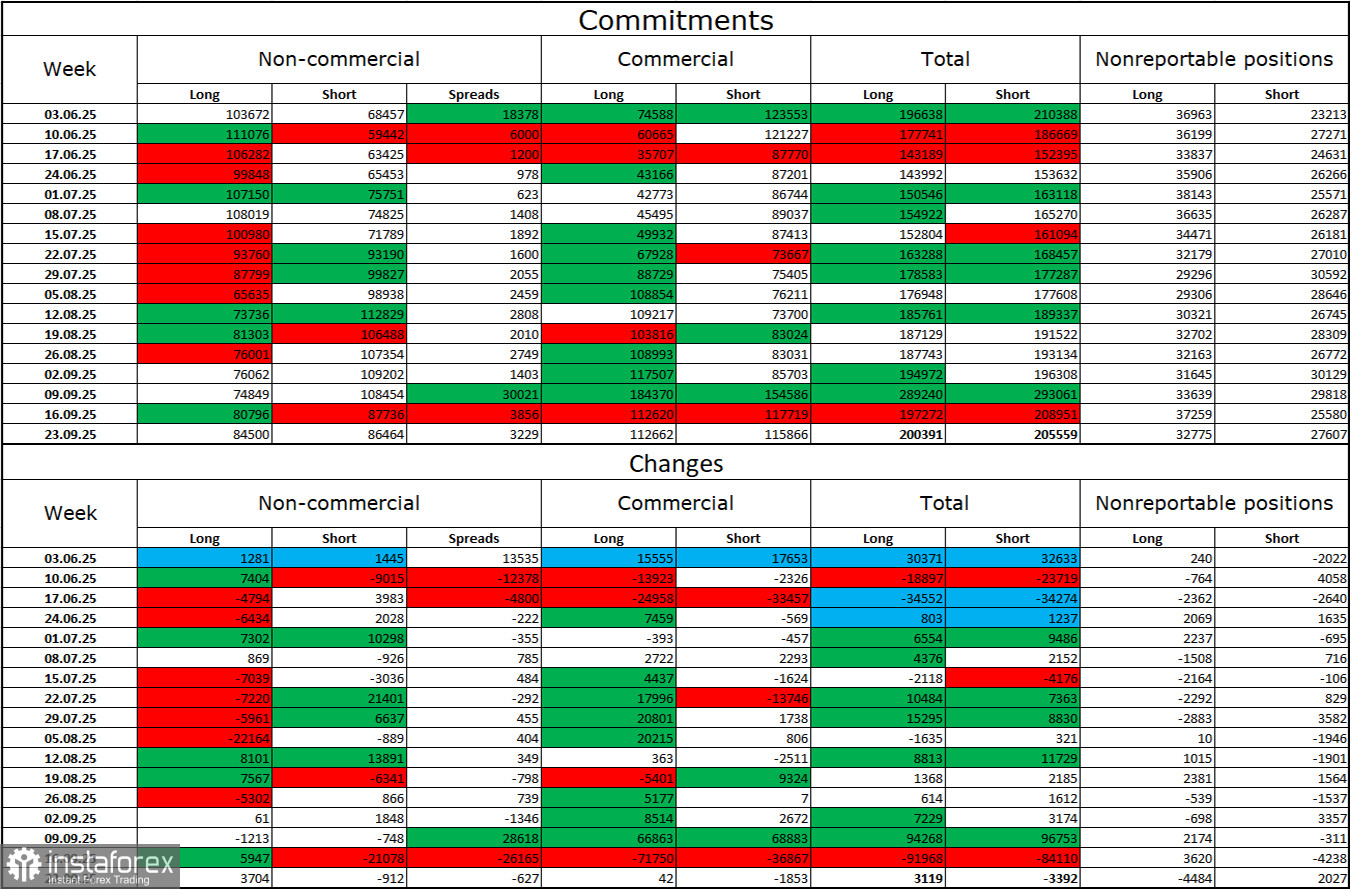
The sentiment among non-commercial traders became more bullish over the last reporting week. The number of long positions held by speculators increased by 3,704, while the number of short positions decreased by 912. The gap between long and short contracts now stands at approximately 85,000 vs. 86,000 — meaning the bulls are once again tilting the balance in their favor.
In my view, the pound still faces prospects for decline, but with each passing month, the U.S. dollar looks weaker and weaker. Previously, traders worried about Donald Trump's protectionist policies, uncertain about their outcomes — now they may be concerned about the consequences: a possible recession, the constant introduction of new tariffs, and Trump's conflict with the Federal Reserve, which could make the regulator politically dependent on the White House. Thus, the pound now looks far less risky than the U.S. dollar.
Economic Calendar for the U.S. and the U.K.:
United Kingdom
- Manufacturing PMI (08:30 UTC)
- Services PMI (08:30 UTC)
United States
- Consumer Price Index (12:30 UTC)
- Manufacturing PMI (13:45 UTC)
- Services PMI (13:45 UTC)
- University of Michigan Consumer Sentiment Index (14:00 UTC)
On October 24, the economic calendar contains six key events, each of which is significant. The fundamental background will have a strong impact on market sentiment throughout the day.
GBP/USD Forecast and Trading Recommendations
Sell positions can be considered if the pair closes below 1.3313 on the hourly chart, with a target of 1.3247. Buy positions can be considered on a rebound from 1.3313, with targets at 1.3354 and 1.3387.
Fibonacci retracement grids are built:
- On the hourly chart — from 1.3526 to 1.3247
- On the 4-hour chart — from 1.3431 to 1.2104