 English
  Русский
 Bahasa Indonesia
 Bahasa Malay
 ไทย
ไทย Español
 Deutsch
 Български
 Français
 Tiếng Việt
 中文
中文 বাংলা
বাংলা हिन्दी
 Čeština
 Українська
 Română

EUR/USD 5M Analysis
The EUR/USD currency pair stood still all day on Monday. This outcome was logical as there were no significant events scheduled for the first trading day of the week, unlike on Friday. Recall that on Friday, business activity indices were published in the Eurozone and the U.S., along with inflation data. Thus, the market had sufficient reasons to trade, rather than remain stagnant. We are not even talking about any specific direction; just movement is beneficial under the current circumstances.
However, on Monday, there was no macroeconomic data, and the announcement of trade agreement discussions between China and the U.S. did not impress traders. In principle, we have already mentioned that Trump's statements currently evoke only yawns from most traders. The U.S. President talks a lot and issues many threats, but when it comes to action, he retreats. Once again, Trump backed off and no longer wants to raise tariffs on China by 100%. The market yawned once more and remained in hibernation mode.
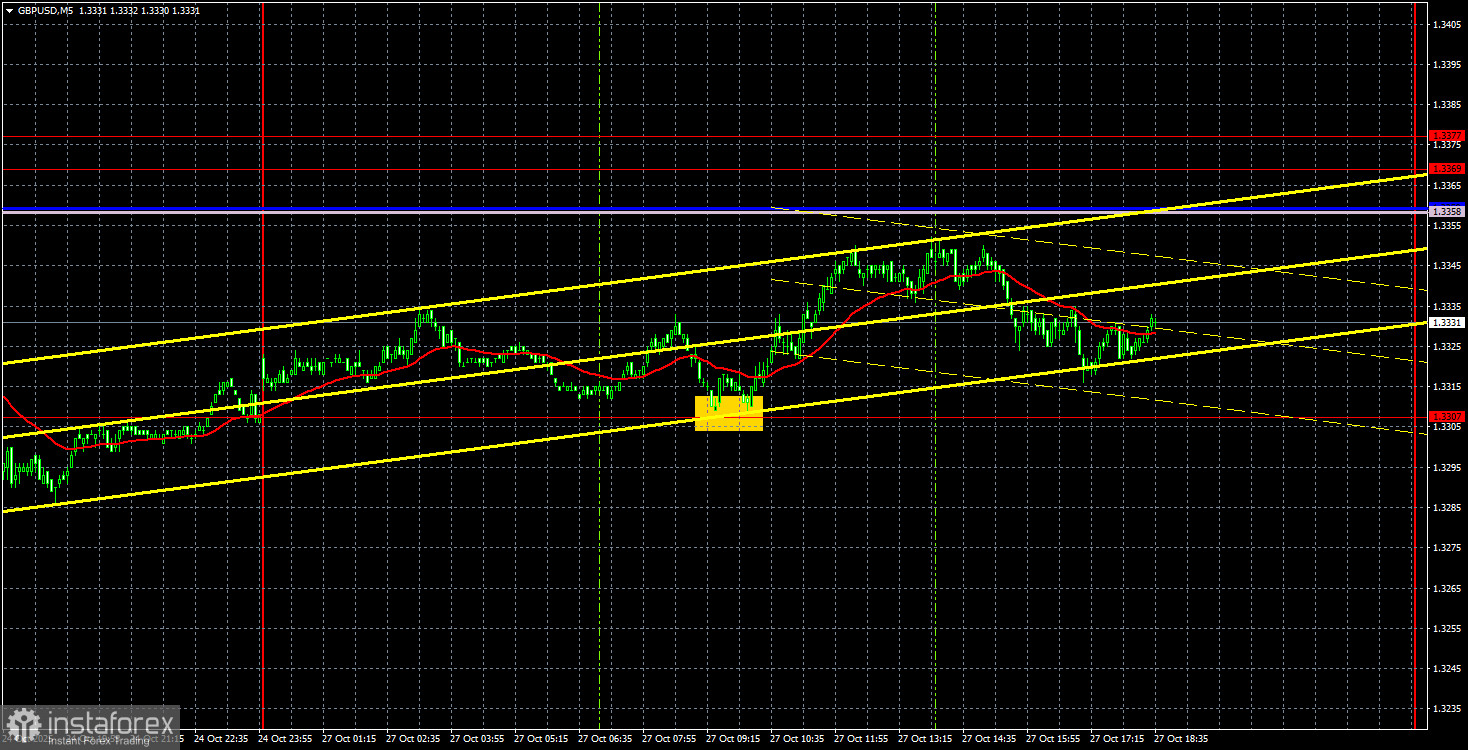
On the 5-minute timeframe, the pair traded all day between the areas of 1.1604-1.1615 and 1.1657-1.1666, with a distance of about 40 pips between them. Neither of these areas was ever fully utilized. This is all you need to know about volatility on Monday. Additionally, there are two Ichimoku indicator lines between these areas, making it pointless to trade between them.
COT Report
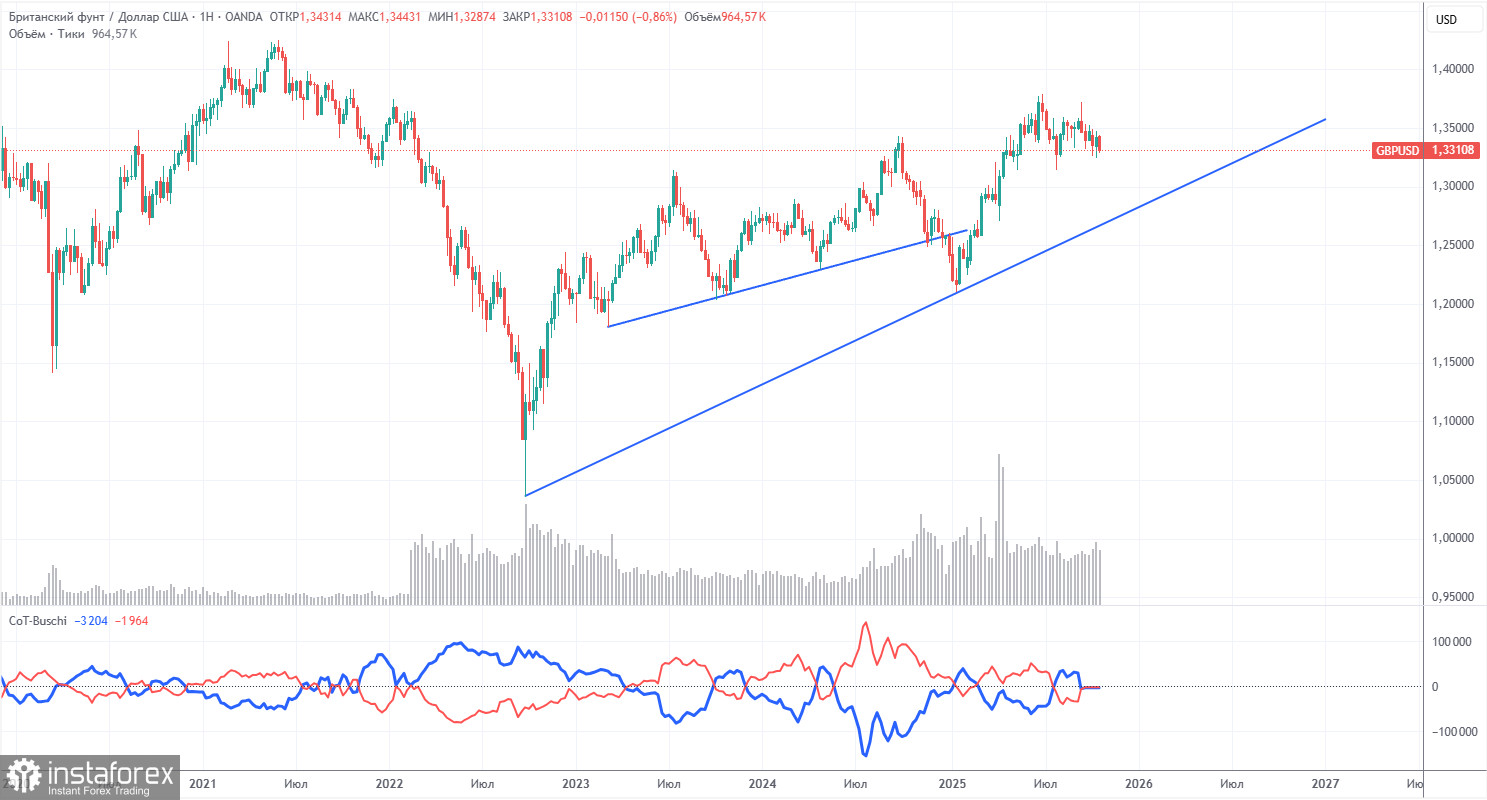
The last COT report is dated September 23. Since then, no further COT reports have been published due to the U.S. "shutdown." The illustration above shows that the net position of non-commercial traders has been "bullish" for a long time, with bears barely entering the zone of their own supremacy at the end of 2024 but quickly losing it. Since Trump took office for a second time, the dollar has been falling. We cannot say that the decline of the U.S. currency will continue with 100% probability, but current developments around the world suggest this is a possibility.
We still do not see any fundamental factors supporting the strengthening of the euro, whereas there are sufficient factors for the decline of the dollar. The global downward trend persists, but what really matters now is where the price has moved over the past 17 years. Once Trump finishes his trade wars, the dollar may rise, but recent events indicate that the war will continue in one form or another. The potential loss of the Fed's independence is another significant pressure factor on the U.S. currency.
The indicator's red and blue lines continue to signal a "bullish" trend. During the last reporting week, the number of longs for the "Non-commercial" group decreased by 800, while the number of shorts increased by 2,600. Consequently, the net position has decreased by 3,400 contracts over the week. However, this data is already outdated and holds no significance.
EUR/USD 1H Analysis
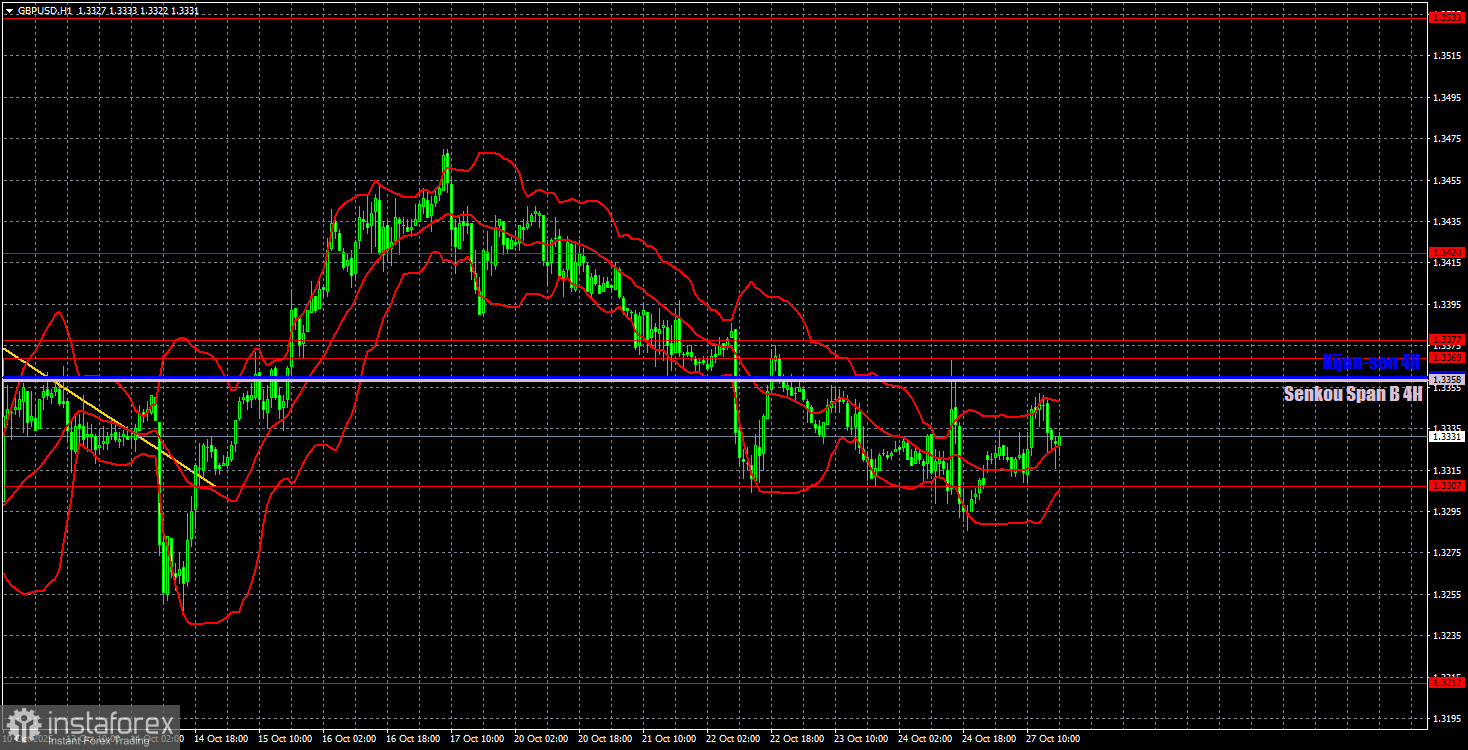
On the hourly timeframe, the EUR/USD pair could have completed its downward trend as far back as the week before last. However, the European currency has been consistently falling recently, and it remains quite challenging to find reasons for this that are not in the realm of science fiction. We believe the main reason for the inadequate and illogical movements lies in the flat market on the daily timeframe. This flat continues to persist.
For October 28, we highlight the following levels for trading: 1.1234, 1.1274, 1.1362, 1.1426, 1.1534, 1.1604-1.1615, 1.1657-1.1666, 1.1750-1.1760, 1.1846-1.1857, 1.1922, 1.1971-1.1988, as well as the Senkou Span B line (1.1637) and the Kijun-sen line (1.1653). The Ichimoku indicator lines may shift during the day, which should be considered when determining trading signals. Remember to place a stop-loss order at breakeven if the price moves in the right direction by 15 pips. This will protect against potential losses if the signal turns out to be false.
On Tuesday, there is again one report scheduled for both the Eurozone and the U.S., this time in Germany—the consumer confidence index. Recall that on Friday, eight much more important reports failed to trigger any volatility in the market. Most likely, we will again face a paltry semblance of movements.
Trading Recommendations:
On Tuesday, traders may take positions from any area or Ichimoku indicator line of their choosing. However, we would advise waiting for the price to leave the 1.1604-1.1666 range, as there are too many levels and lines within it. It is also important to remember the very low volatility.
Explanations for the Illustrations:
Price support and resistance levels are depicted as thick red lines around which price movement may occur. They are not sources of trading signals.
The Kijun-sen and Senkou Span B lines are Ichimoku indicator lines that have been transferred from the 4-hour timeframe to the hourly timeframe. They are strong lines.
Extreme levels are shown as thin red lines, from which the price previously bounced. They are sources of trading signals.
Yellow lines indicate trend lines, trend channels, and any other technical patterns.
Indicator 1 on the COT charts represents the net position size for each category of traders.