 English
  Русский
 Bahasa Indonesia
 Bahasa Malay
 ไทย
ไทย Español
 Deutsch
 Български
 Français
 Tiếng Việt
 中文
中文 বাংলা
বাংলা हिन्दी
 Čeština
 Українська
 Română

After testing the 1622.5 level on October 23, the price reached the MACD support line this morning and forcefully breached it. The daily candle will likely close below this line, opening the target support at 1463.5—the September 3 peak. Overcoming this level would open the target range of 1355.5-1372.0 (the low from September 17).
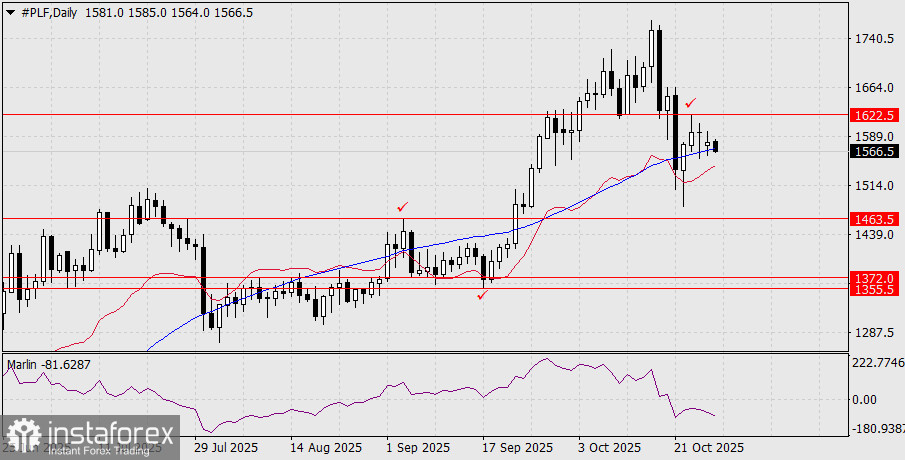
The Marlin oscillator has been in negative territory since October 21, when a strong price drop occurred. Since then, the oscillator's position has not changed, as it continues to help the price explore new lows.
On the H4 chart, the price has been trading below the balance indicator line for a long time – a sign that all attempts at price growth have been corrective.
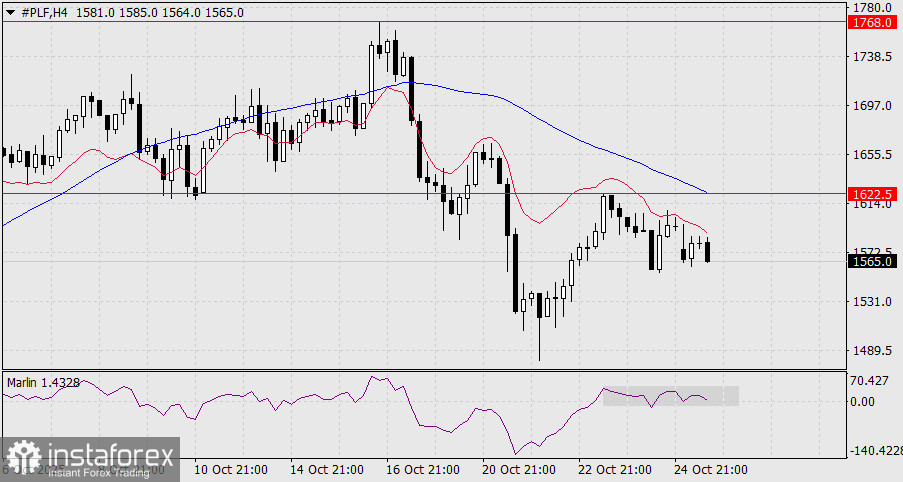
Both indicator lines – the balance and MACD – are declining, indicating the prevailing direction of the medium-term trend. The Marlin oscillator is consolidating around the zero line and is ready to enter a downward move.
An alternative scenario may unfold if the price firmly establishes itself above 1622.5. The MACD line has reinforced this level, so a breakout above this strong resistance could lead to a retest of the October 16 peak at 1768.0.