 English
  Русский
 Bahasa Indonesia
 Bahasa Malay
 ไทย
ไทย Español
 Deutsch
 Български
 Français
 Tiếng Việt
 中文
中文 বাংলা
বাংলা हिन्दी
 Čeština
 Українська
 Română

The EUR/USD currency pair resumed its decline on Thursday, even before the European Central Bank meeting results were announced. Recall that a significant macroeconomic data package was released yesterday in the Eurozone. Could this have caused the euro's decline? Let's analyze.
The unemployment rate in Germany remained unchanged, while the number of unemployed decreased by 1,000 against much more pessimistic forecasts. The third-quarter GDP came in at 0%, as anticipated. In the Eurozone, GDP growth was 0.2%, even exceeding forecasts. Despite this fairly neutral information, the euro declined again.
As a reminder, the day before, the Federal Reserve announced the results of its penultimate meeting, during which the key rate was cut by 0.25%. Nothing about this decision was surprising, as all market participants expected it. Jerome Powell's speech also offered little to traders. In short, Powell failed to surprise the market with new statements compared to previous meetings and speeches. Thus, there was no reason for the American currency to rise on Wednesday evening or Thursday morning.
Yet, the euro continues to fall while the dollar rises. We believe this is a continuation of illogical movement within the flat on the daily timeframe. From any angle you look at it, there is no reason for the dollar to appreciate. If the market buys the American currency amid de-escalation in the trade conflict with China, it seems a questionable reason, since the market has ignored news of the escalation of the trade war against India, China, and several other countries since the beginning of October. Remember, the dollar began its latest upward cycle precisely at the start of October, when Donald Trump stirred things up again.
Purchasing dollars based on insufficiently "dovish" signals from the Fed is absurd. Neither Jerome Powell nor his colleagues have ever promised to lower the rate at every upcoming meeting, nor have they ever provided any forecasts for the rate for any meeting in advance. Thus, once again, a situation has arisen in which the market has conjured its own expectations for how the Fed should conduct monetary easing, only to be disappointed when the central bank behaves differently.
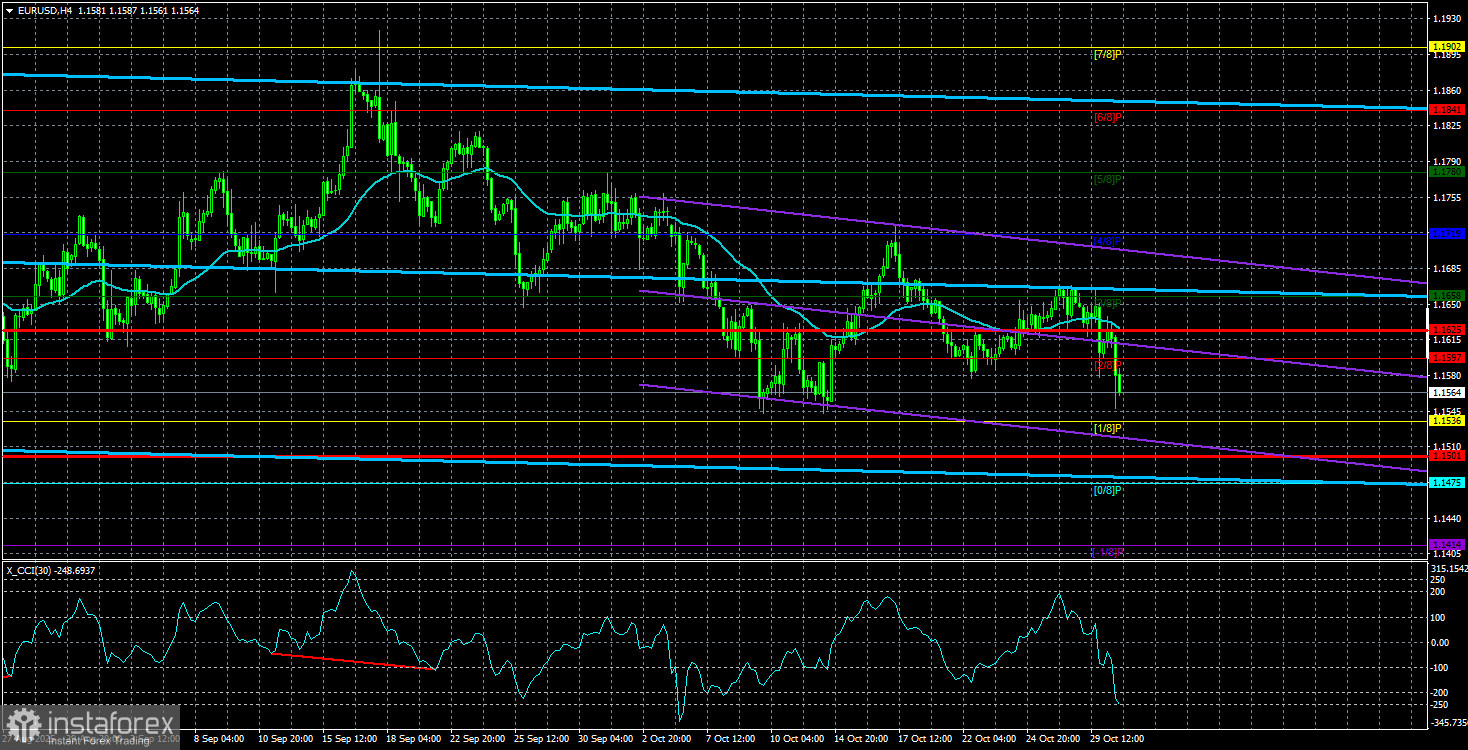
Overall, the dollar continues to show moderate upward movement, as shown on the daily timeframe. On the 4-hour chart and lower, it may seem that we are within a strong trend, but the daily timeframe puts everything into perspective. Firstly, the upward trend for 2025 remains intact. Secondly, the current downward correction is even weaker than the previous one (the first amounted to just 23.6% on the Fibonacci scale). Thirdly, the flat persists, with a presumed lower line around 1.1400. Thus, the euro can fall quite freely to 1.1400 and still represent a flat and a downward correction within the global upward trend.
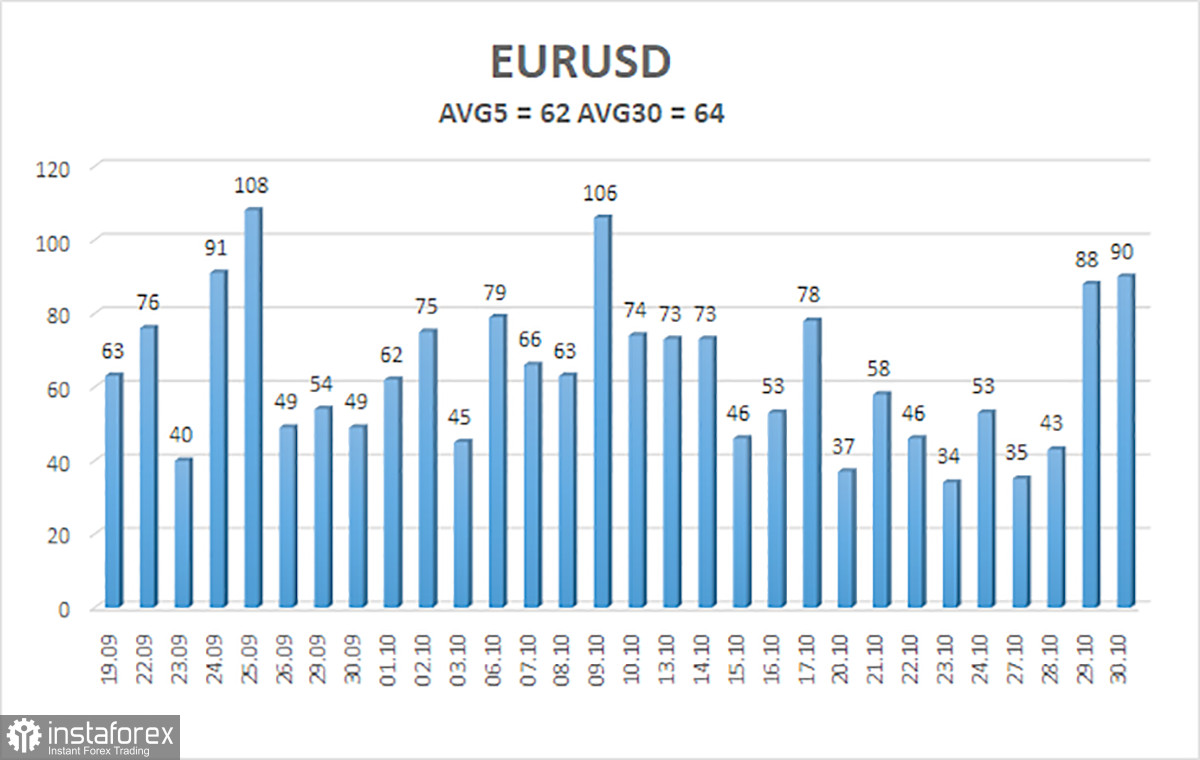
The average volatility of the EUR/USD currency pair over the last 5 trading days as of October 31 is 62 pips, which is considered "average." We expect the pair to move between levels 1.1501 and 1.1625 on Friday. The upper channel of linear regression is directed upward, still indicating a bullish trend. The CCI indicator has entered oversold territory, which may signal a new upward trend.
Nearest Support Levels:
- S1 – 1.1536
- S2 – 1.1475
- S3 – 1.1414
Nearest Resistance Levels:
- R1 – 1.1597
- R2 – 1.1658
- R3 – 1.1719
Trading Recommendations:
On Friday, traders can expect the decline to continue and may trade from the area of 1.1604-1.1615 or from the level of 1.1534. As we stated earlier, given the flat on the daily timeframe, the euro's decline may continue for technical reasons.
Explanations for the Illustrations:
- Support and Resistance Levels: Thick red lines where movement may end; they do not provide trading signals.
- Kijun-sen and Senkou Span B Lines: Ichimoku indicator lines transferred to the hourly timeframe from the 4-hour. They are strong lines.
- Extreme Levels: Thin red lines where the price previously bounced; these are sources of trading signals.
- Yellow Lines: Trend lines, trend channels, and any other technical patterns.
- Indicator 1 on COT Charts: The size of the net position for each category of traders.