 English
  Русский
 Bahasa Indonesia
 Bahasa Malay
 ไทย
ไทย Español
 Deutsch
 Български
 Français
 Tiếng Việt
 中文
中文 বাংলা
বাংলা हिन्दी
 Čeština
 Українська
 Română

Trend Analysis (Fig. 1)
On Friday, the market may continue moving downward from the 1.3150 level (the closing price of yesterday's daily candle) toward the 1.3115 target — the lower fractal (daily candle from October 30, 2025). Upon testing this level, a pullback movement upward toward 1.3148 is possible — a historical resistance level (blue dotted line).
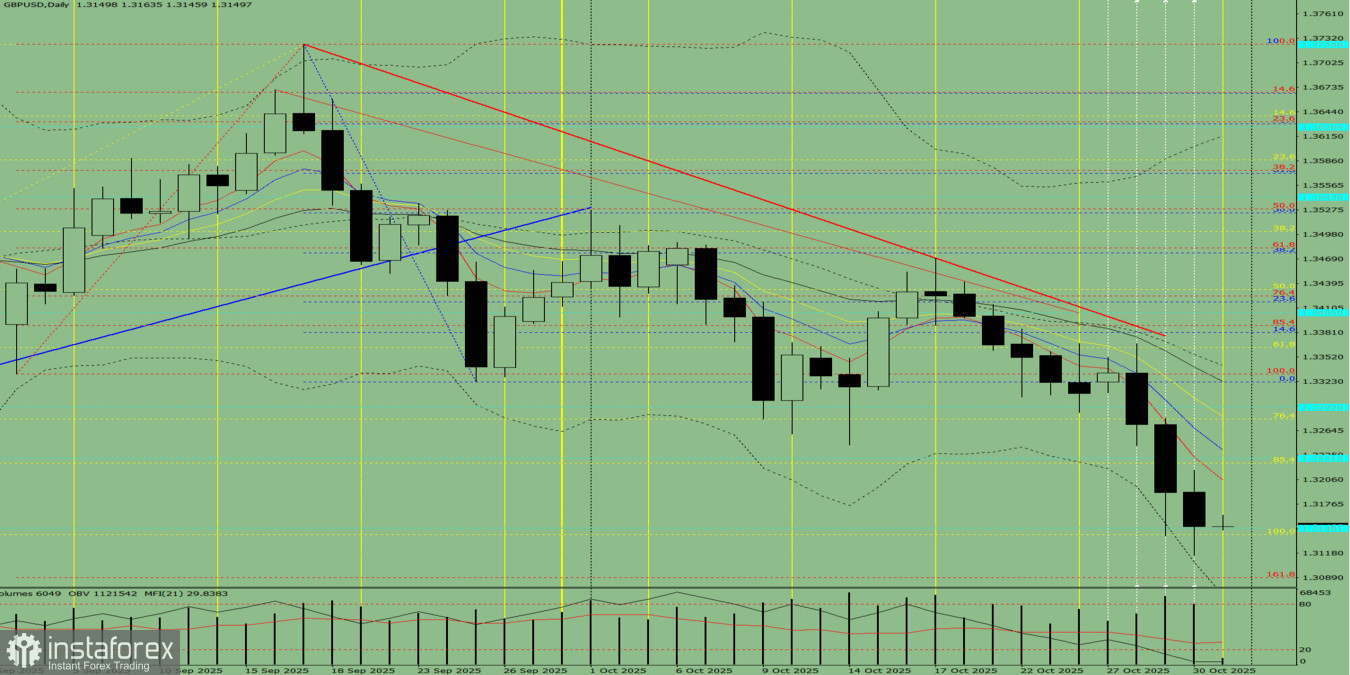
Fig. 1 (Daily Chart)
Comprehensive Analysis:
- Indicator analysis – downward
- Fibonacci levels – downward
- Volumes – downward
- Candlestick analysis – downward
- Trend analysis – downward
- Bollinger Bands – downward
- Weekly chart – upward
Overall conclusion: Downward trend.
Alternative scenario:From the 1.3150 level (the closing price of yesterday's daily candle), the price may continue moving downward toward 1.3089 — the 161.8% target level (red dotted line). Upon testing this level, a pullback upward movement toward 1.3115 — the lower fractal (daily candle from October 30, 2025) — is possible.