 English
  Русский
 Bahasa Indonesia
 Bahasa Malay
 ไทย
ไทย Español
 Deutsch
 Български
 Français
 Tiếng Việt
 中文
中文 বাংলা
বাংলা हिन्दी
 Čeština
 Українська
 Română

While Bitcoin continues to experience volatility and turbulence — which is beneficial for day traders — Standard Chartered Bank forecasts that the market capitalization of tokenized real-world assets (RWAs), excluding stablecoins, is expected to surge to $2 trillion by 2028, up from approximately $35 billion today.
"Stablecoins have laid the groundwork by increasing awareness, liquidity, and credit availability on the blockchain for other asset classes, from tokenized money market funds (MMFs) and cash funds to tokenized stocks," stated the report from Standard Chartered.
This projection paints a picture of a rapidly evolving financial landscape where digital assets are becoming increasingly integrated into the traditional economy. Tokenization of real assets is the process of converting ownership rights to physical or intangible assets into digital tokens that can then be bought, sold, and transferred on the blockchain. The potential for tokenization is vast; it enhances asset liquidity, reduces transaction costs, expands access to investments, and creates new financial products. For example, real estate, artwork, bonds, and more can be tokenized, opening doors for a broader range of investors and streamlining trading and management processes.
An increase in the RWA market capitalization to $2 trillion by 2028 will signify the maturity of blockchain technologies and their capability to transform global financial markets. It will also highlight the growing role of tokenized assets in diversifying investment portfolios and finding new sources of income.
Standard Chartered Bank anticipates that the overwhelming majority of this activity will take place on Ethereum, citing its reliability. "Ethereum has operated for over ten years without major issues on the mainnet. The fact that other blockchains may be faster or cheaper is, in our view, irrelevant," the report notes. "Of that $2 trillion, we see around $750 billion coming from tokenized money market funds due to corporate usage of stablecoins; another $750 billion from tokenized stocks; $250 billion from tokenized index funds; and the remaining $250 billion from less liquid segments of private equity, commodities, corporate debt, and real estate."
The report emphasizes that it is stablecoins that have created several necessary prerequisites for the broader adoption of this trend through three pillars: increased public awareness, on-chain liquidity, and on-chain lending. The bank believes that lending, and particularly RWAs, are two key areas where DeFi protocols can disrupt traditional finance (TradFi).
Trading recommendations
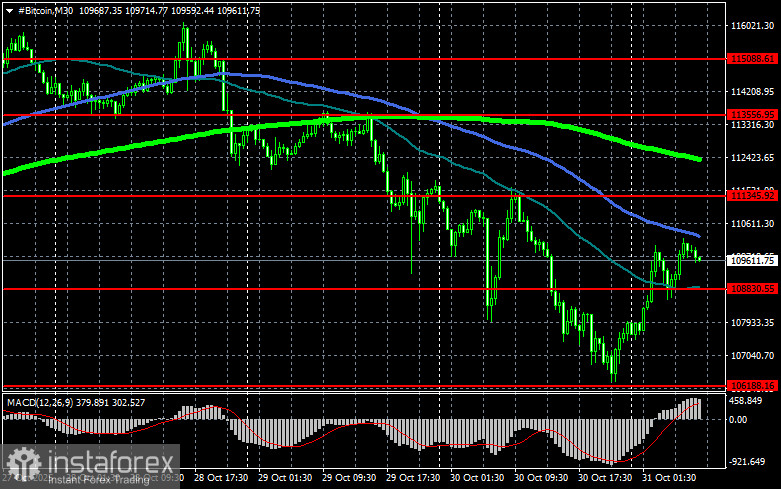
From a technical viewpoint, Bitcoin buyers are currently aiming to reclaim the $111,300 level, which would open a direct path to $113,500, and then it's just a short distance to the $115,000 mark. The farthest target would be the high around $116,700; surpassing this would signify a strengthening bullish market. In the case of a downturn, I expect buyers at the $108,800 level. A return of the trading instrument below this area could quickly push BTC down to around $106,200, with the further target being the $103,400 region.
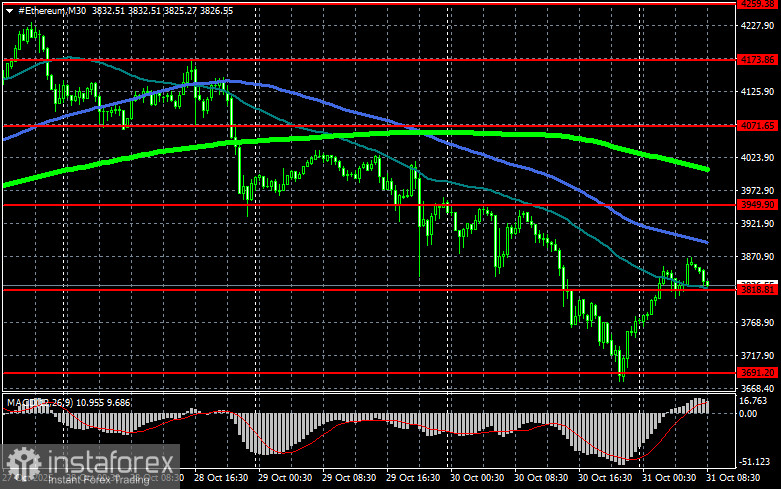
Regarding Ethereum's technical outlook, a firm consolidation above the $3,949 level opens a direct route to $4,071. The most extended target will be the high around $4,173; exceeding this would indicate a strengthening bullish market and increased buyer interest. Should Ethereum decline, I expect buyers at the $3,818 level. A return of the trading instrument below this area could swiftly drop ETH to around $3,691, with the further target being the $3,505 region.
Chart indicators
- Red indicators represent support and resistance levels, where a slowdown or active price increase is expected.
- Green represents the 50-day moving average.
- Blue indicates the 100-day moving average.
- Light green signifies the 200-day moving average.
Crossovers or tests of the moving averages usually halt or set the market's momentum.