 English
  Русский
 Bahasa Indonesia
 Bahasa Malay
 ไทย
ไทย Español
 Deutsch
 Български
 Français
 Tiếng Việt
 中文
中文 বাংলা
বাংলা हिन्दी
 Čeština
 Українська
 Română

The EUR/USD pair came to a halt on Wednesday. For more than a week, the euro had been falling, but on Wednesday the decline stopped — and no upward movement began either. Since earlier the pair consolidated below the 76.4% Fibonacci level at 1.1517, a rebound from this level today would allow traders to expect a continued decline toward the next corrective level of 100.0% – 1.1392. A consolidation of the pair's rate above 1.1517 would work in favor of the euro and lead to moderate growth toward the 61.8% Fibonacci level at 1.1594.
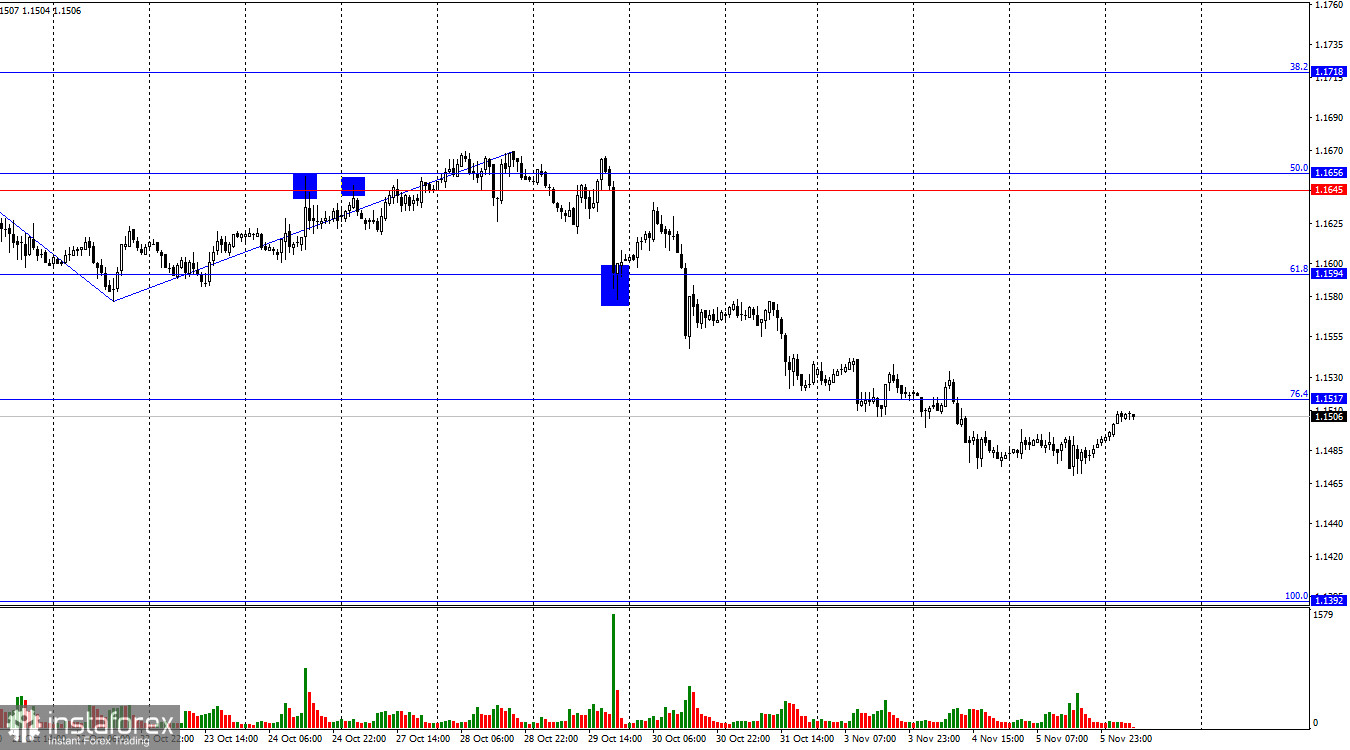
The wave structure on the hourly chart remains simple and clear. The last completed upward wave failed to break the previous high, while the most recent downward wave has already broken the previous low. Thus, the trend has once again turned bearish. Bullish traders have once more been unable to take advantage of the opportunities for an upward move, while bears continue to attack largely on enthusiasm alone, without informational support.
On Wednesday, neither bulls nor bears saw reason to open positions — surprising, given that Wednesday was the most eventful day in terms of economic data. On Monday, traders received the ISM Manufacturing PMI, but yesterday not only another ISM Services Index was released, but also the important ADP private-sector employment report. It should be noted that this report, produced by a private company, excludes several industries in its job count. Therefore, Nonfarm Payrolls remain the key labor market indicator. However, payrolls and unemployment data have not been published for a month and a half, as Democrats and Republicans in the U.S. still cannot reach an agreement to end the government shutdown.
Nevertheless, both of yesterday's reports were better than traders expected — yet this did not help the dollar. Are the bears simply exhausted?
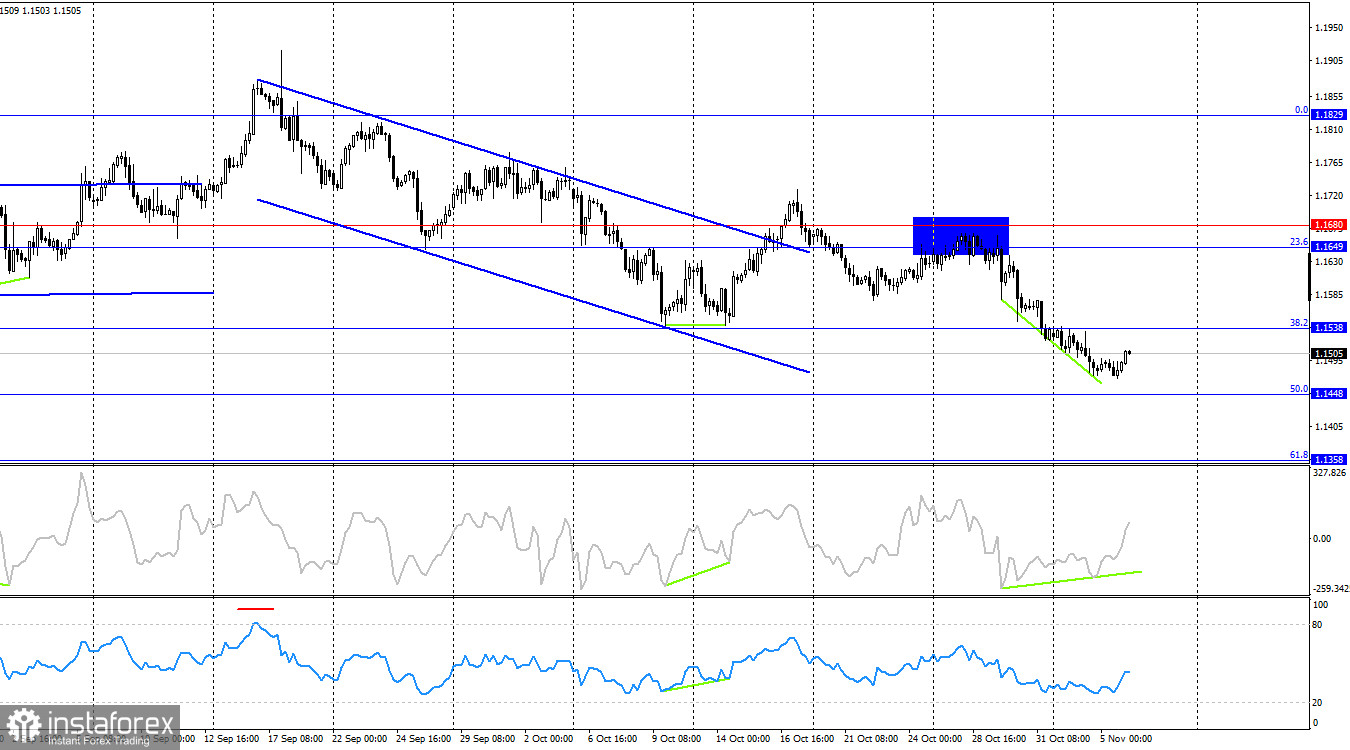
On the 4-hour chart, the pair rebounded from the 1.1649–1.1680 resistance level, turned in favor of the U.S. dollar, and consolidated below the 38.2% Fibonacci level – 1.1538. Thus, the decline may continue toward the next corrective level of 50.0% at 1.1448. A rebound from 1.1448 would favor the euro and trigger a moderate rise. A consolidation below 1.1448 would increase the likelihood of a continued fall toward the next Fibonacci level of 61.8% at 1.1358. The CCI indicator is showing signs of a potential bullish divergence.
Commitments of Traders (COT) Report
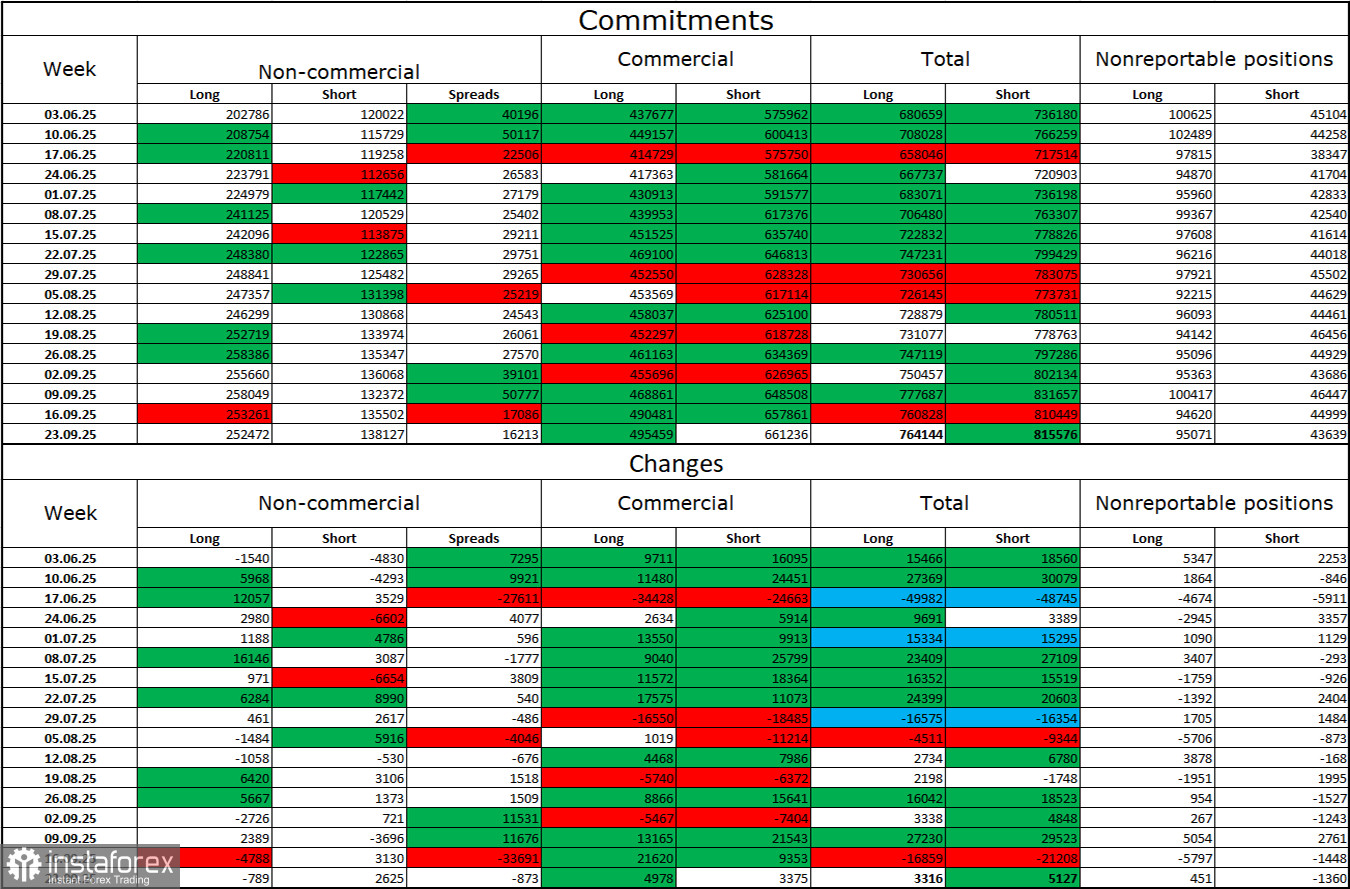
During the most recent reporting week, professional traders closed 789 long positions and opened 2,625 short positions. No new COT reports have been released for over a month. The sentiment of the Non-commercial group remains bullish thanks to Donald Trump, and it continues to strengthen over time. The total number of long positions held by speculators now stands at 252,000, while short positions total 138,000 — a nearly two-to-one ratio.
In addition, note the number of green cells in the table above (referring to the original report). They indicate strong growth in euro positions. In most cases, interest in the euro is rising, while interest in the dollar is declining.
For thirty-three consecutive weeks, major players have been reducing their short positions and increasing longs. Donald Trump's policies remain the most significant factor for traders, as they could cause a number of long-term, structural problems for the U.S. economy. Despite the signing of several major trade agreements, many key economic indicators continue to show decline.
Economic Calendar for the U.S. and the Eurozone
- Eurozone – Germany Industrial Production Change (07:00 UTC)
- Eurozone – Retail Sales Change (10:00 UTC)
On November 6, the economic calendar includes two entries, neither of which can be considered major. The impact of the news background on market sentiment Thursday morning is expected to be mild.
EUR/USD Forecast and Trader Recommendations
At this point, I do not recommend considering new short positions, as I believe the bears have already exceeded their targets by a wide margin. Buying can be considered if the pair consolidates above 1.1517, with a target at 1.1594.
Fibonacci grids are built between 1.1392–1.1919 on the hourly chart and 1.1066–1.1829 on the 4-hour chart.