 English
  Русский
 Bahasa Indonesia
 Bahasa Malay
 ไทย
ไทย Español
 Deutsch
 Български
 Français
 Tiếng Việt
 中文
中文 বাংলা
বাংলা हिन्दी
 Čeština
 Українська
 Română

The fish rots from the head down. The Magnificent Seven stocks led the S&P 500 rally and were the first to dive during the sell-off. NVIDIA experienced its worst day since the January stock market rout due to the emergence of Chinese competitor DeepSeek. The company's market capitalization shrank by a staggering $440 billion. Only 18 of the 500 issuers have a market value greater than this figure. Is it any surprise that the tech giants caught in the sell-off dragged the entire broad stock index down with them?
Magnificent Seven Stocks Dynamics
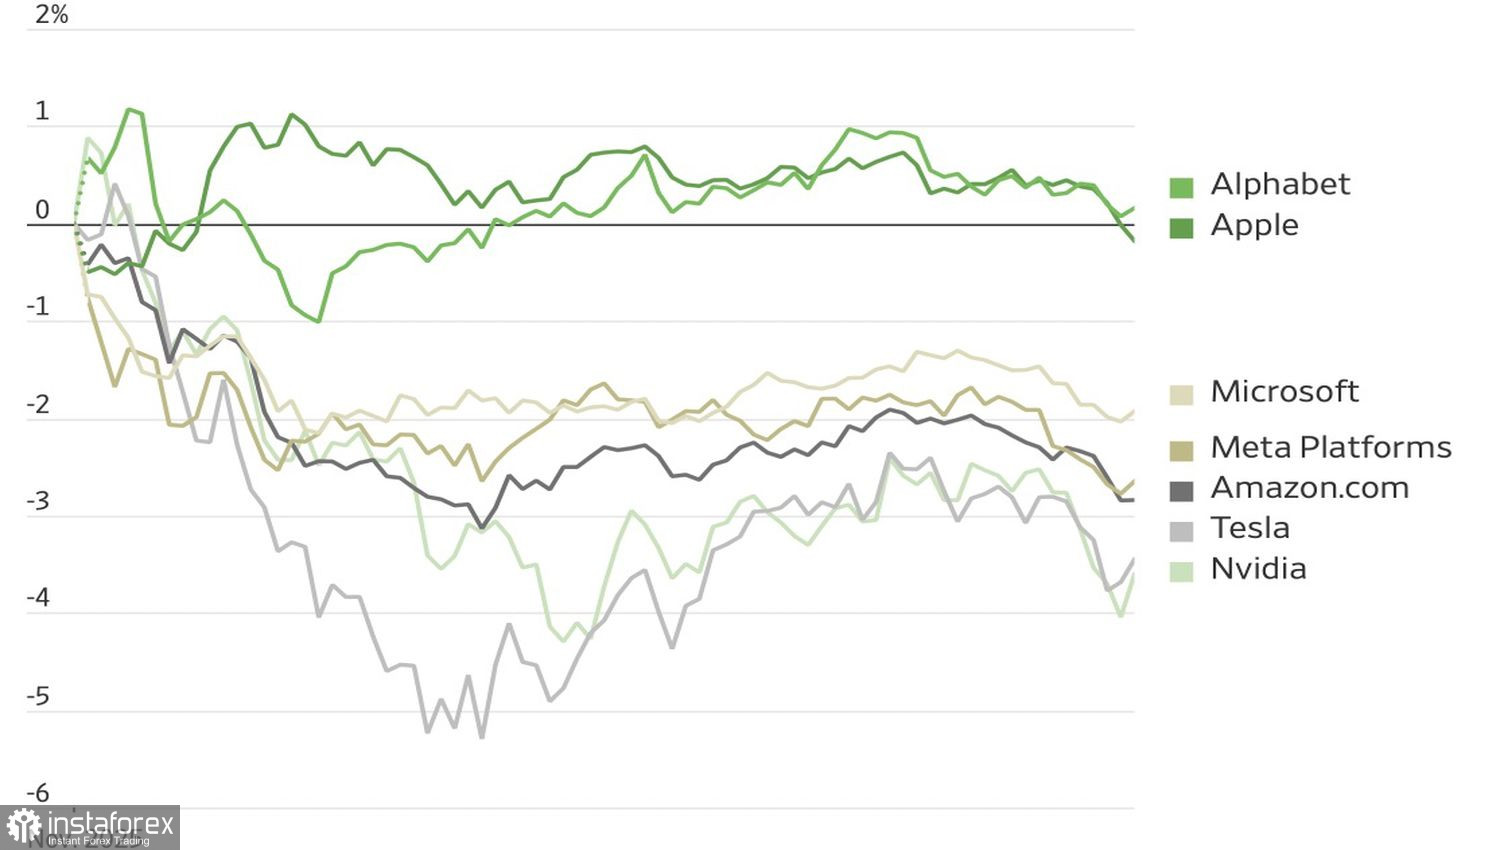
Everything comes to an end, both good and bad. The earnings season for July to September served the S&P 500 faithfully until early November. Eighty-three percent of the 424 companies that reported exceeded Wall Street expectations for profits, with revenues surpassing forecasts by 10.4%. In both cases, these are the best results since the second quarter of 2021.
Once again, the Magnificent Seven were the market leaders. However, their performance is merely the tip of the iceberg. Beneath the surface lies a different picture. With the exception of Amazon and Tesla, the consumer discretionary sector is undergoing a profit recession. Sales among small-cap companies within the Russell 2000 increased by a modest 1.1% year-over-year. The materials sector is staying afloat solely due to rising precious metal prices.
High tariffs and the associated increase in costs amid declining consumer activity, crucial for revenue and profit, are forcing companies to tighten their belts. In October, they announced layoffs totaling more than 153,000, three times higher than September's figure. According to Revelio Labs, employment decreased by 9,100 after an increase of 33,000 in the first month of autumn.
Market Capitalization to US Economy Ratio Dynamics
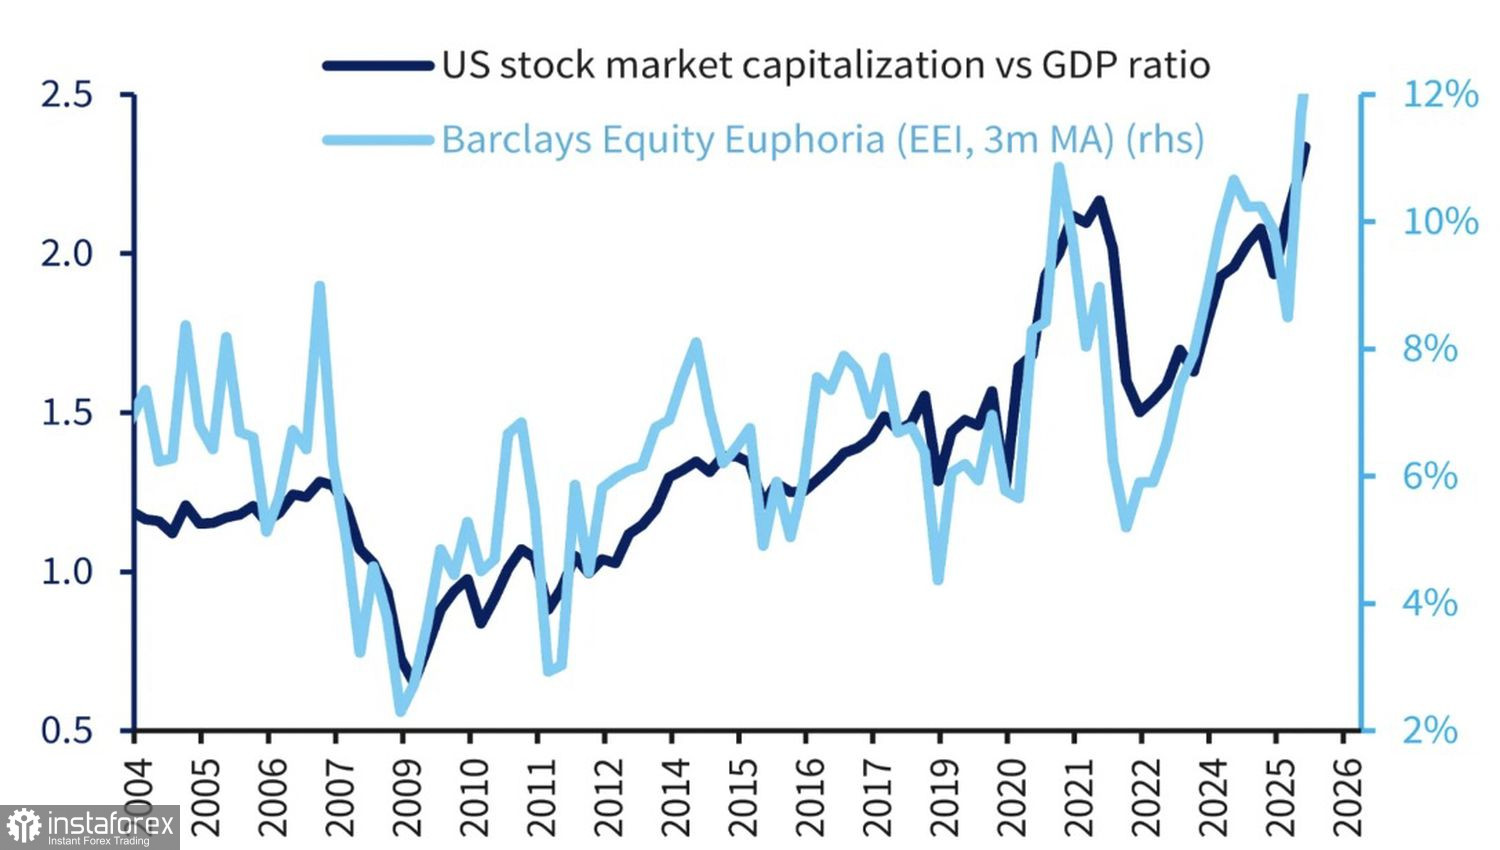
Thus, it is not as rosy for market leaders as it appears. Overvaluations of tech giants and doubts about the profitability of investments in artificial intelligence have triggered sell-offs in the S&P 500. According to Warren Buffett's indicator, the broad stock index is clearly overvalued. This metric compares the current capitalization of $72 trillion with the size of the US economy. The market value is twice the GDP, even accounting for its impressive growth in the second and likely the third quarters.
Not all S&P 500 buyers are ready to wave the white flag. JP Morgan notes that seasonal increases in cash flows from retail investors at the end of the year traditionally support the broad stock index. Will this be the case this time?
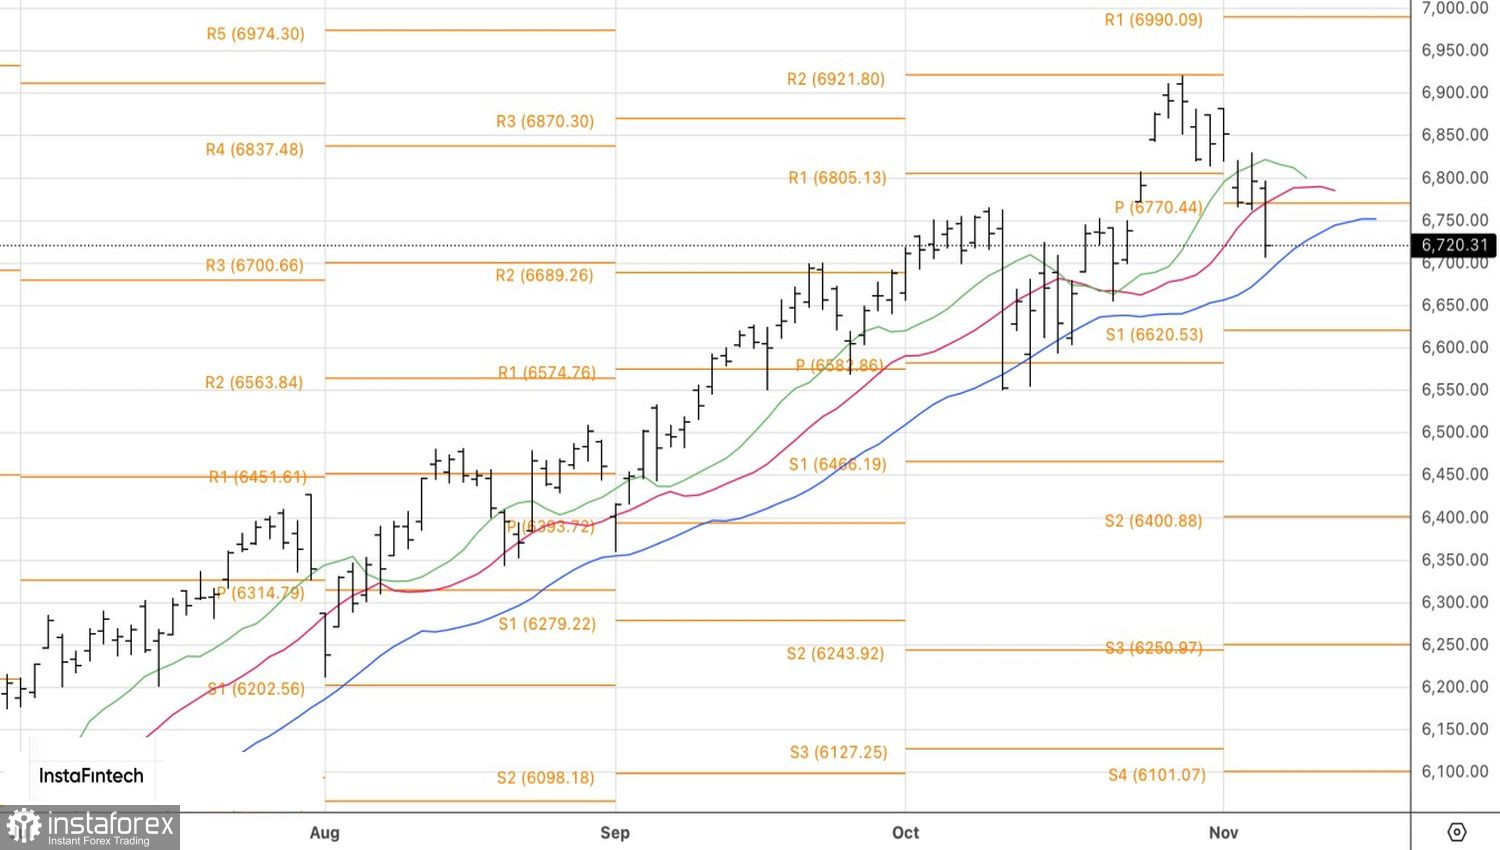
Technically, the daily chart of the S&P 500 shows a pullback after the upward trend. A breakout of two out of three moving averages indicates the seriousness of the bears' intentions. As long as quotes remain below the fair value of 6,740, it makes sense to hold and increase short positions opened at 6,770.