 English
  Русский
 Bahasa Indonesia
 Bahasa Malay
 ไทย
ไทย Español
 Deutsch
 Български
 Français
 Tiếng Việt
 中文
中文 বাংলা
বাংলা हिन्दी
 Čeština
 Українська
 Română

On Thursday, the EUR/USD pair reversed in favor of the European currency, began to rise, and consolidated above the 76.4% retracement level at 1.1517. Thus, the upward movement may continue toward the next Fibonacci retracement level of 61.8% – 1.1594. A close below 1.1517 would favor the U.S. dollar and signal a renewed decline toward the 100.0% Fibonacci level at 1.1392.
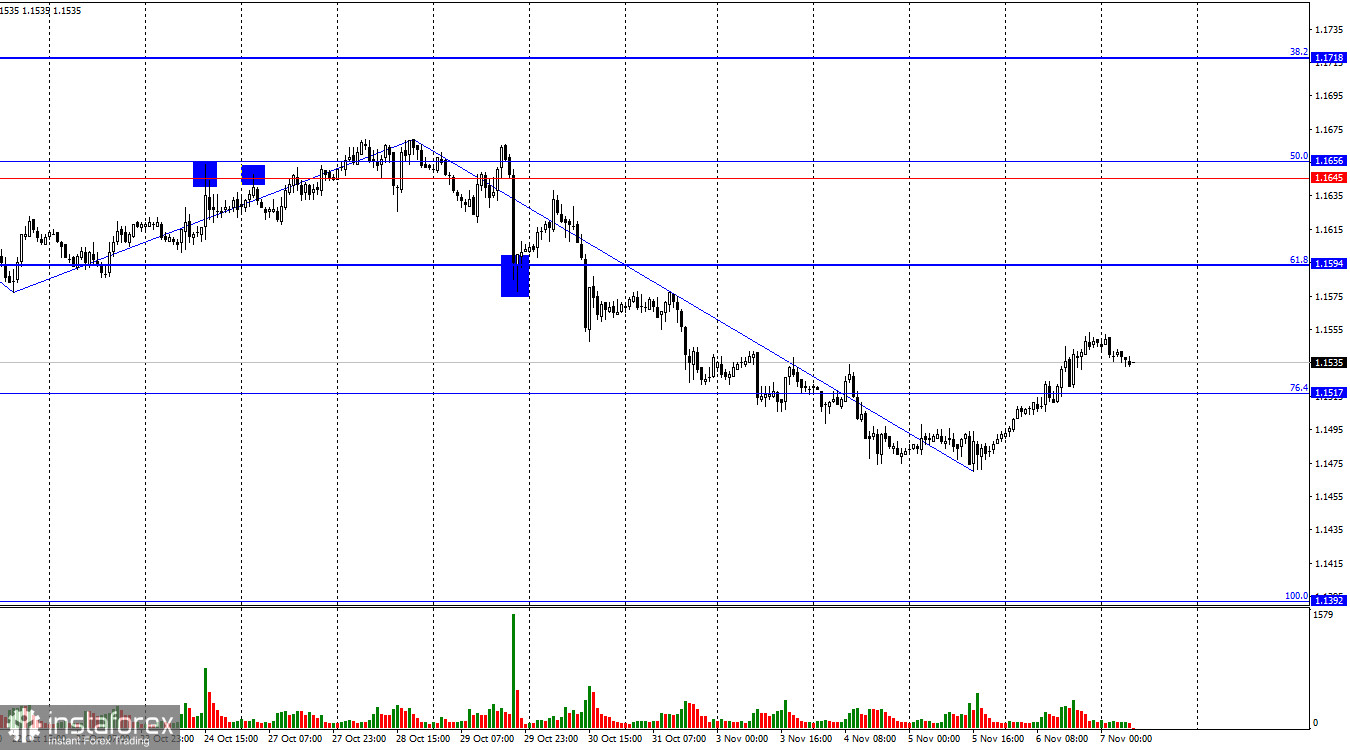
The wave structure on the hourly chart remains simple and clear. The last completed upward wave did not break the previous peak, while the last downward wave broke the previous low. Therefore, the trend currently remains bearish. Bullish traders are not taking advantage of the opportunities to advance, while bears are attacking mostly on sheer enthusiasm, without any strong informational support. To consider the current bearish trend complete, the pair needs to rise above 1.1656.
On Thursday, all trader attention was focused on the Bank of England meeting, and European data went largely unnoticed. This was evident even from the pair's movement during the day — steady growth, despite both European reports coming in worse than expected. However, the Bank of England was not the cause of the euro or pound's rise. Bulls simply started their attack yesterday, and I hope their advance doesn't end today.
Let's recall that the U.S. government shutdown has been ongoing for over a month. It has already surpassed the previous record for duration, which was also set under Donald Trump. Many experts had previously said the shutdown would end quickly, since it benefits neither Democrats nor Republicans. However, I'd note that no shutdown benefits anyone — not Congress, not the economy, not the country. That's not an argument. In the current situation, Democrats are feeling increasingly confident, as various polls show that American citizens blame Republicans for the shutdown. Therefore, it's the Republicans who must find a way out of the current situation. The shutdown could easily continue for several more weeks.
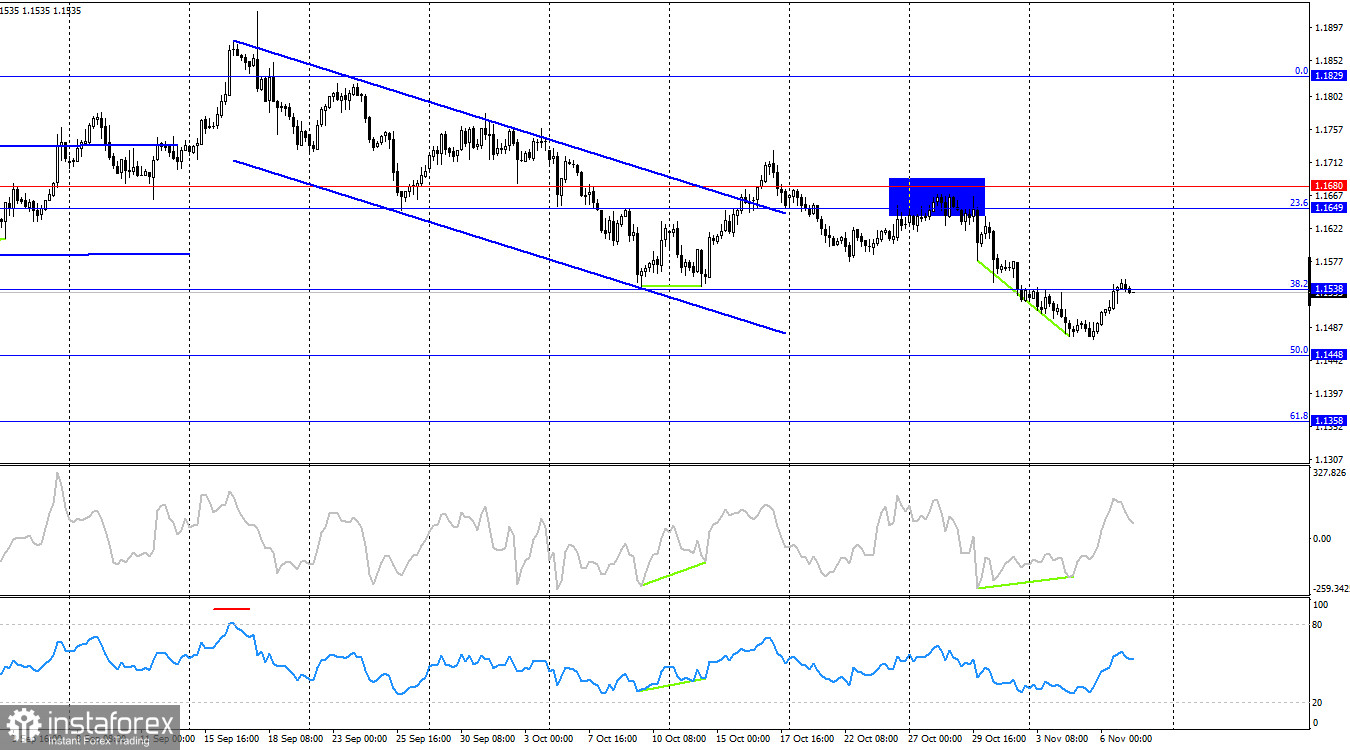
On the 4-hour chart, the pair reversed in favor of the euro after a bullish divergence appeared on the CCI indicator, and it rose toward the 38.2% Fibonacci level at 1.1538. A rebound from this level would favor the U.S. dollar and signal a new decline toward the 50.0% retracement level at 1.1448. A close above 1.1538 would increase the likelihood of further growth toward the resistance level of 1.1649–1.1680.
Commitments of Traders (COT) Report:
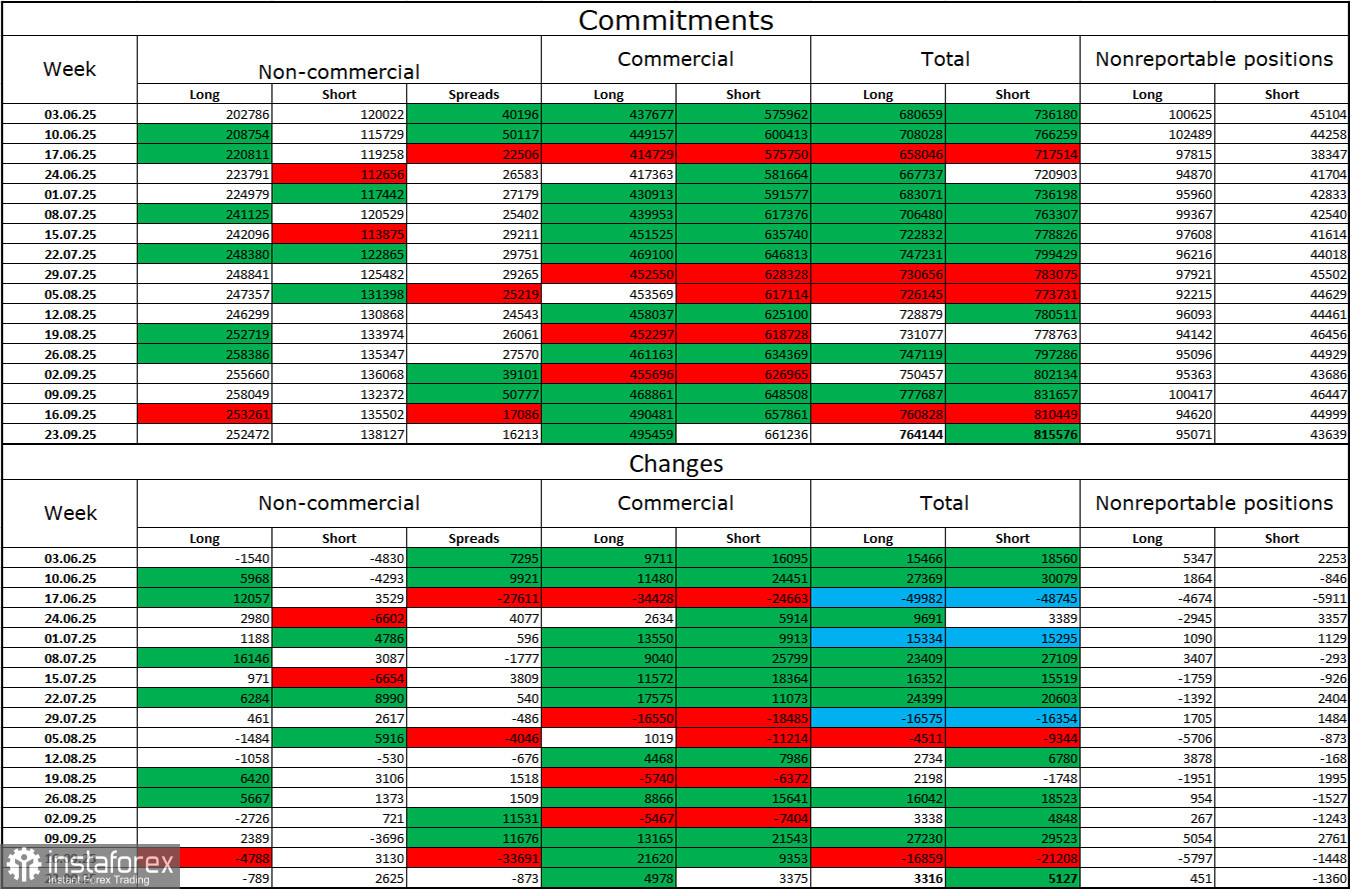
During the last reporting week, professional traders closed 789 long positions and opened 2,625 short positions. There have been no new COT reports for more than a month. The sentiment of the Non-commercial category remains bullish, strengthened largely by Donald Trump's policies, and continues to grow over time.
The total number of long positions held by speculators is now 252,000, while short positions number 138,000 — a nearly two-to-one gap. Also, note the large number of green cells in the summary table — they indicate strong accumulation of positions in the euro. In most cases, interest in the euro continues to grow, while interest in the dollar is declining.
For 33 consecutive weeks, major market participants have been reducing short positions and increasing longs. Donald Trump's policy remains the key factor for traders, as it may create long-term structural problems for the U.S. economy. Despite the signing of several important trade agreements, many key economic indicators continue to show decline.
News Calendar for the U.S. and Eurozone:
- U.S. – University of Michigan Consumer Sentiment Index (15:00 UTC)
The November 7 economic calendar includes just one item, which is unlikely to attract much market attention. The influence of the news background on market sentiment on Friday may be weak.
EUR/USD Forecast and Trader Recommendations:
At present, I do not recommend new sell positions, as I believe the bears have already exceeded their targets by a wide margin. Buy positions could be considered after consolidation above 1.1517, with a target of 1.1594. These long positions can remain open today.
The Fibonacci grids are built between 1.1392–1.1919 on the hourly chart and 1.1066–1.1829 on the 4-hour chart.