 English
  Русский
 Bahasa Indonesia
 Bahasa Malay
 ไทย
ไทย Español
 Deutsch
 Български
 Français
 Tiếng Việt
 中文
中文 বাংলা
বাংলা हिन्दी
 Čeština
 Українська
 Română

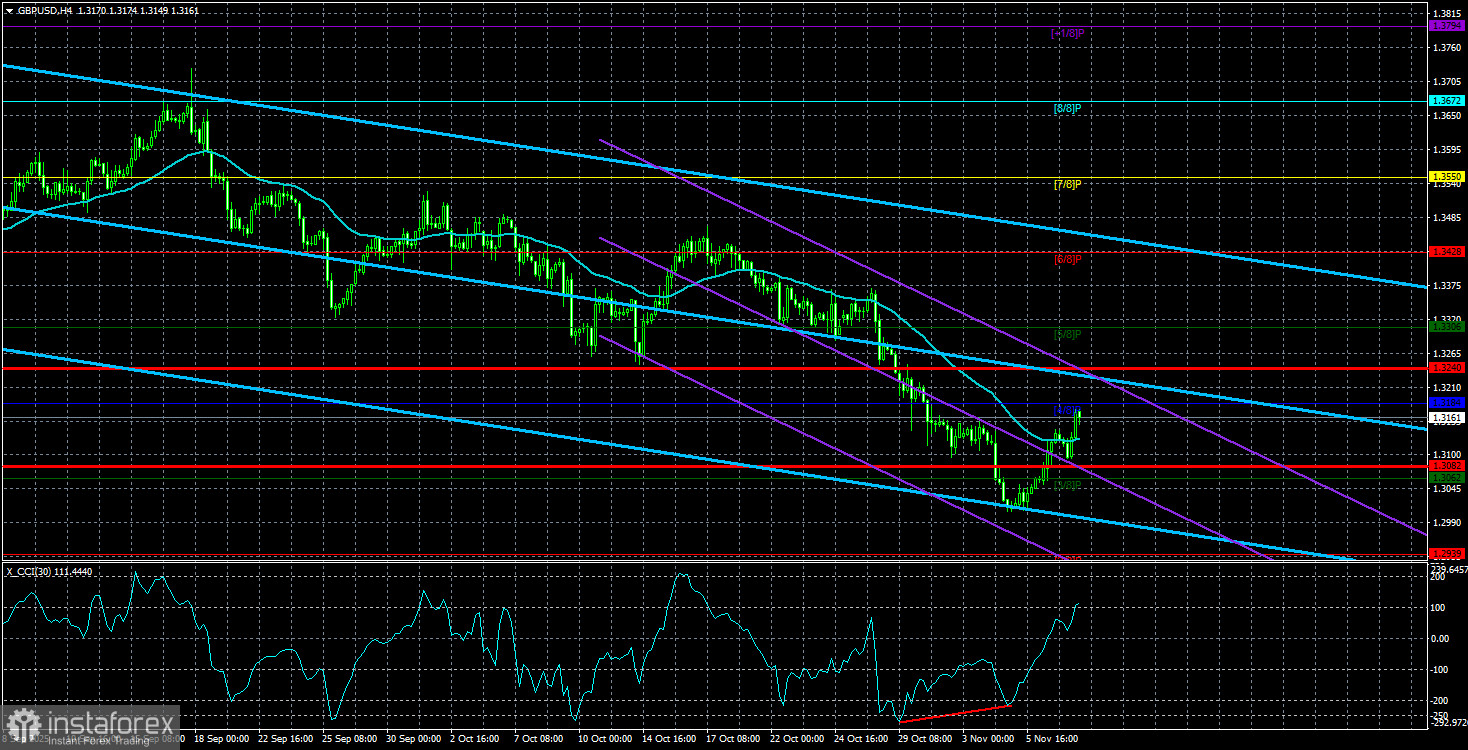
The GBP/USD currency pair showed a fairly good rise on Friday, allowing it to settle above the moving average line on the 4-hour timeframe. It should be noted (as seen in the illustration above) that the pair has broken above the moving average before, but in the previous two cases, the expected and logical growth did not commence. Concurrently, the CCI indicator has consistently been showing "bullish" divergence or entering the oversold area on a weekly basis. There are no fundamental or macroeconomic reasons for the pair to decline; however, the U.S. dollar has stubbornly risen for almost a month and a half against all odds. The flat trend on the daily timeframe no longer looks flat, as the price has settled below its lower boundary.
Since there are still no reasons for the dollar to rise, we continue to view the current decline as a correction. The correction will inevitably come to an end, so the key factor now is finding the appropriate time to open new long positions. It is important to remember that the euro remains within a sideways channel on the daily timeframe. If it begins to rise within this channel, the pound is likely to follow suit.
In recent weeks, the market has seized every opportunity to sell the British currency and has interpreted almost all events occurring in the UK and the U.S. in favor of the dollar. For instance, we learned that the "shutdown" is not a real issue for the U.S. economy, the Fed is exhibiting "insufficient dovishness," and the Bank of England will, in any case, continue to ease its monetary policy. In reality, the situation is quite the opposite. The "shutdown" will lead to a slowdown in GDP growth, which, combined with a weakening labor market, could even result in a recession in the U.S. The Federal Reserve will continue its monetary easing at first due to labor-market weaknesses, and in 2026 due to the Monetary Policy Committee becoming even more subservient to Trump. The BoE has nearly made a decision to lower the key rate and has stated that inflation will decrease in the coming years. However, whether inflation will actually decrease remains an open question. If it does, further cuts to the key rate are possible. But what if it does not?
Thus, we believe that the U.S. dollar has risen unjustifiably and excessively over the past month and a half. Even if the decline continues, we will still only consider an upward trend and look for buying opportunities. In the near future, the GBP/USD pair may rise to 1.3260, where the critical Kijun-sen line lies on the daily chart. Ideally, we would like to see growth at least up to 1.3430, where the Senkou Span B line is located.
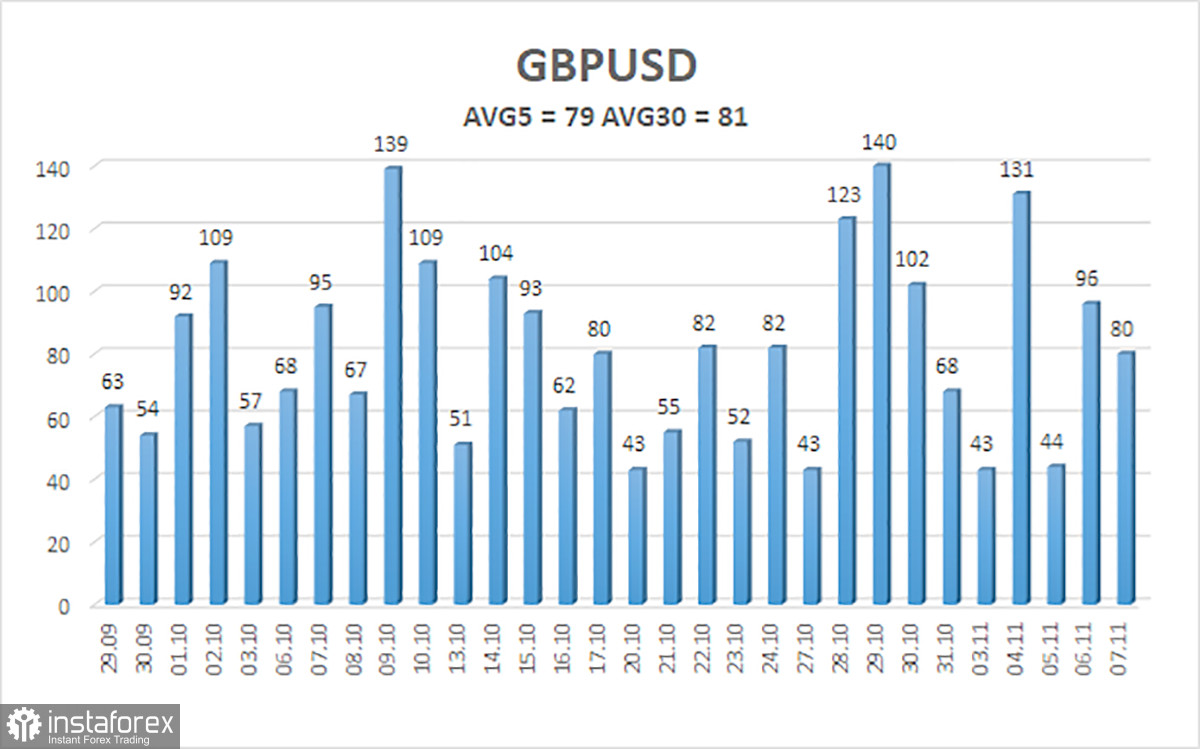
The average volatility of the GBP/USD pair over the last five trading days is 79 pips, which is considered "average" for the pound-dollar pair. Therefore, on Monday, November 10, we expect movement within the range between 1.3082 and 1.3240. The upper channel of linear regression is directed downwards, but there is a technical correction occurring on higher timeframes. The CCI indicator has entered the oversold area four times, warning of a resumption of the upward trend. A new "bullish" divergence has formed, from which the last upward movement began.
Nearest Support Levels:
- S1 – 1.3062
- S2 – 1.2939
- S3 – 1.2817
Nearest Resistance Levels:
- R1 – 1.3184
- R2 – 1.3306
- R3 – 1.3428
Trading Recommendations:
The GBP/USD currency pair is attempting to resume the 2025 upward trend, and its long-term prospects have not changed. Donald Trump's policies will continue to exert pressure on the dollar, so we do not expect the U.S. dollar to rise. Therefore, long positions with targets at 1.3260 and 1.3430 remain relevant for the near future as long as the price is above the moving average. If the price is below the moving average line, small short positions can be considered with targets at 1.3062 and 1.2939 based on technical factors. The American currency occasionally shows corrections (on a global scale), but for a trend to strengthen, it needs real signs of an end to the trade war or other global positive factors.
Explanations for Illustrations:
- Linear regression channels help determine the current trend. If both are directed in the same way, it indicates that the trend is currently strong.
- The moving average line (settings 20,0, smoothed) defines the short-term trend and the direction in which trading should currently be conducted.
- Murray levels are target levels for movements and corrections.
- Volatility levels (red lines) represent the likely price channel in which the pair will spend the following days, based on current volatility indicators.
- The CCI indicator entering the oversold territory (below -250) or overbought territory (above +250) indicates that a trend reversal in the opposite direction is approaching.