 English
  Русский
 Bahasa Indonesia
 Bahasa Malay
 ไทย
ไทย Español
 Deutsch
 Български
 Français
 Tiếng Việt
 中文
中文 বাংলা
বাংলা हिन्दी
 Čeština
 Українська
 Română

GBP/USD Analysis on 5M
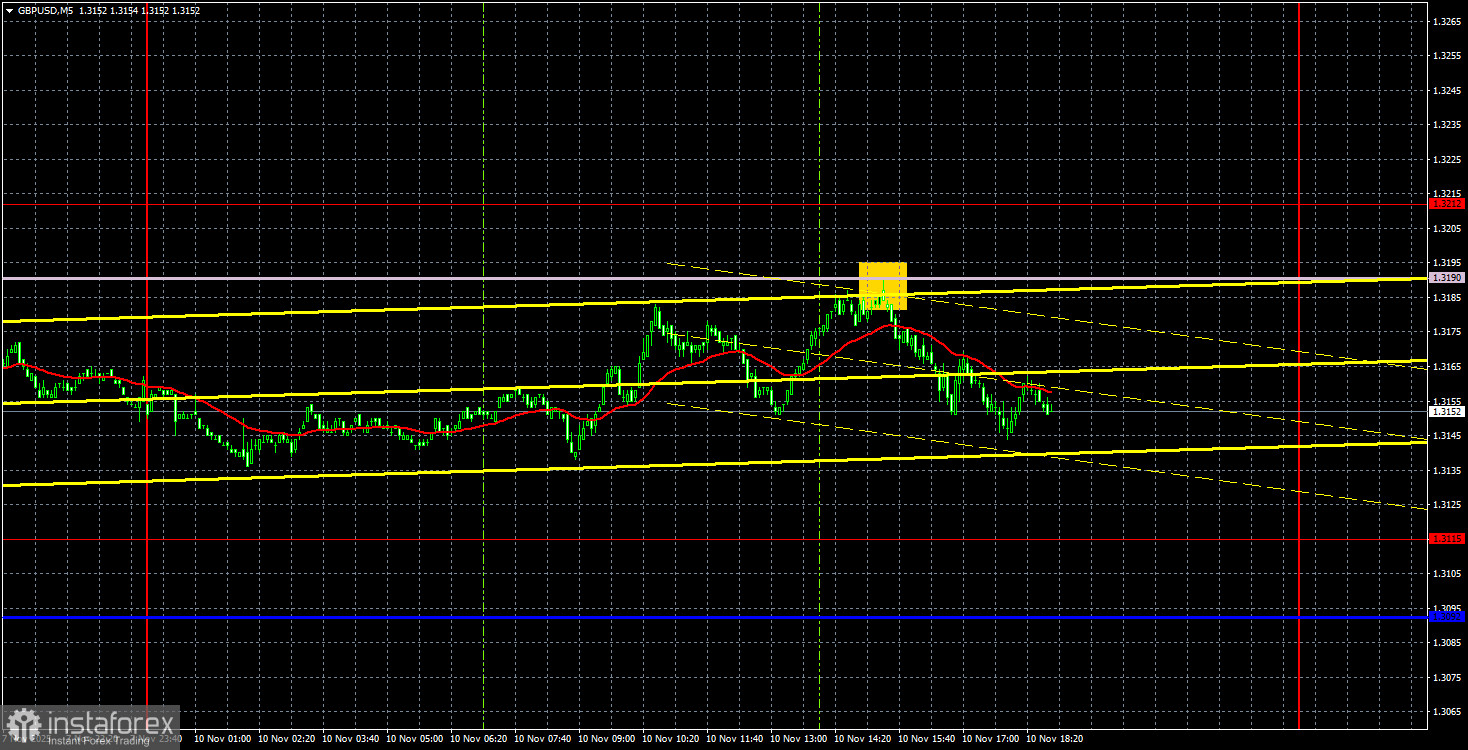
The GBP/USD currency pair continued its weak upward movement, with minimal volatility, on Monday, testing the Senkou Span B line. The bounce off this strong and important line provoked a slight decline in the pair during the latter half of the day. Thus, at this time, we cannot confidently state that the local downward trend is complete. The same picture is observed with the euro currency; the price also failed to breach the Senkou Span B line on the first attempt. In both cases, a breach of the Ichimoku cloud on the 4-hour timeframe is required to expect an upward trend. The British pound also has a trendline that needs to be surpassed.
The macroeconomic backdrop was absent on Monday in both the UK and the U.S., and news of the potential end to the "shutdown" soon failed to impress anyone. Although we consider this to be quite an important event for the U.S. economy, the market continues to either ignore significant events or respond to them illogically. We believe that technical factors are currently more important than fundamental or macroeconomic considerations.
On the 5-minute timeframe, a single trading signal was generated on Monday. During the American trading session, the price bounced off the Senkou Span B line, allowing traders to open short positions. While we wouldn't expect strong movement, there was an opportunity to earn about 20 pips from this trade, which is quite reasonable given the overall 50-pip volatility.
COT Report
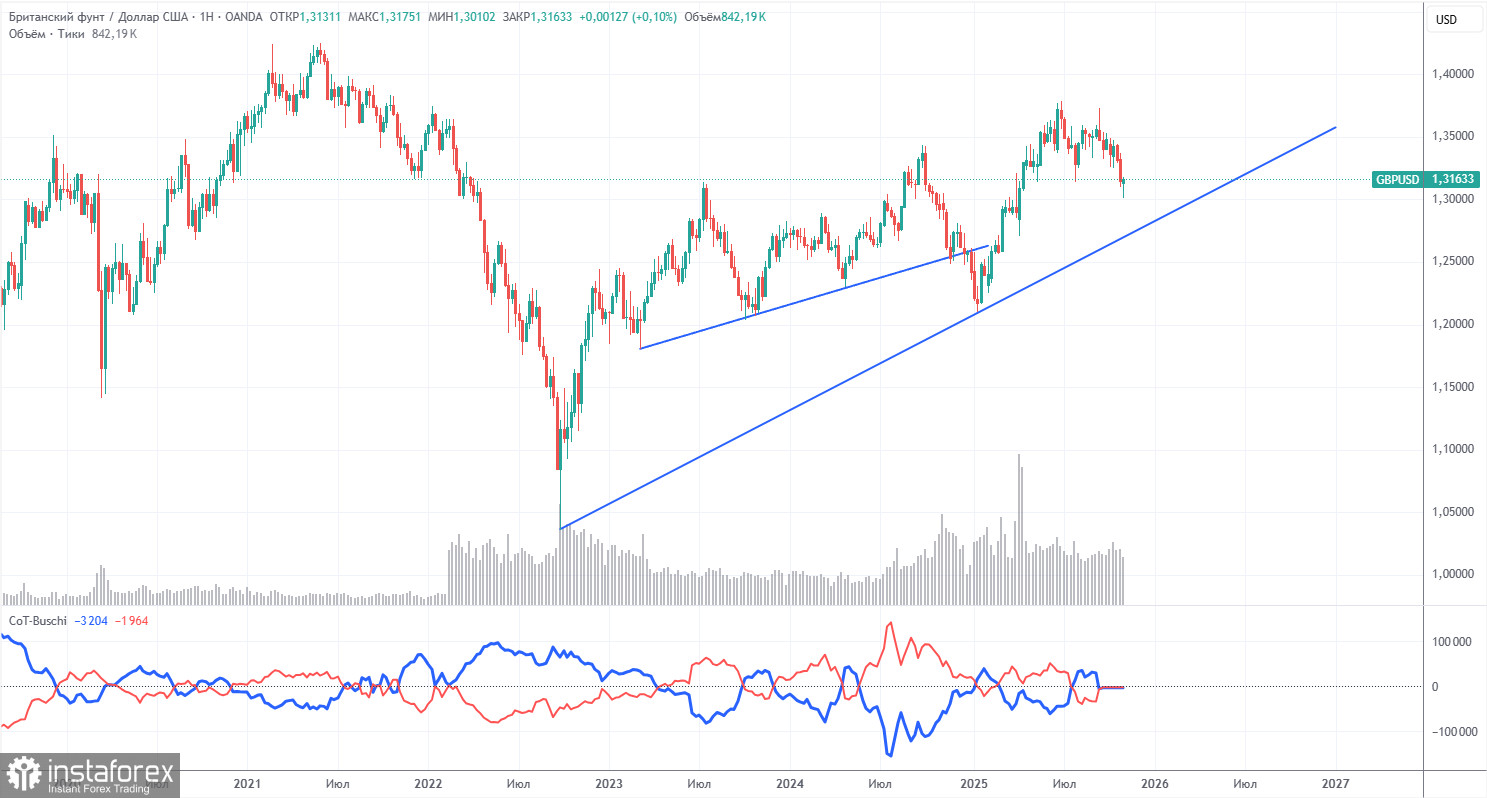
COT reports for the British pound show that commercial traders' sentiment has been changing constantly in recent years. The red and blue lines representing the net positions of commercial and non-commercial traders frequently cross each other and are mostly near the zero mark. Currently, they are at almost the same level, indicating approximately equal amounts of long and short positions.
The dollar continues to decline due to Donald Trump's policies, so market makers' demand for sterling is not particularly significant at the moment. The trade war will continue in one form or another for a long time. The Fed will, in any case, lower rates in the coming year, leading to a decline in dollar demand in one way or another. According to the latest report (dated September 23) on the British pound, the "Non-commercial" group opened 3,700 BUY contracts and closed 900 SELL contracts. Thus, the net position of non-commercial traders increased by 4,600 contracts over the week. However, this data is already outdated, and there are no new reports.
In 2025, the pound rose significantly, but one must understand that this was due to Donald Trump's policies. Once this reason is mitigated, the dollar may begin to rise, but when this will happen is anyone's guess. It does not matter how fast the net position for the pound is increasing or decreasing. The net position for the dollar is declining in any case, and it is generally declining faster.
GBP/USD Analysis on 1H
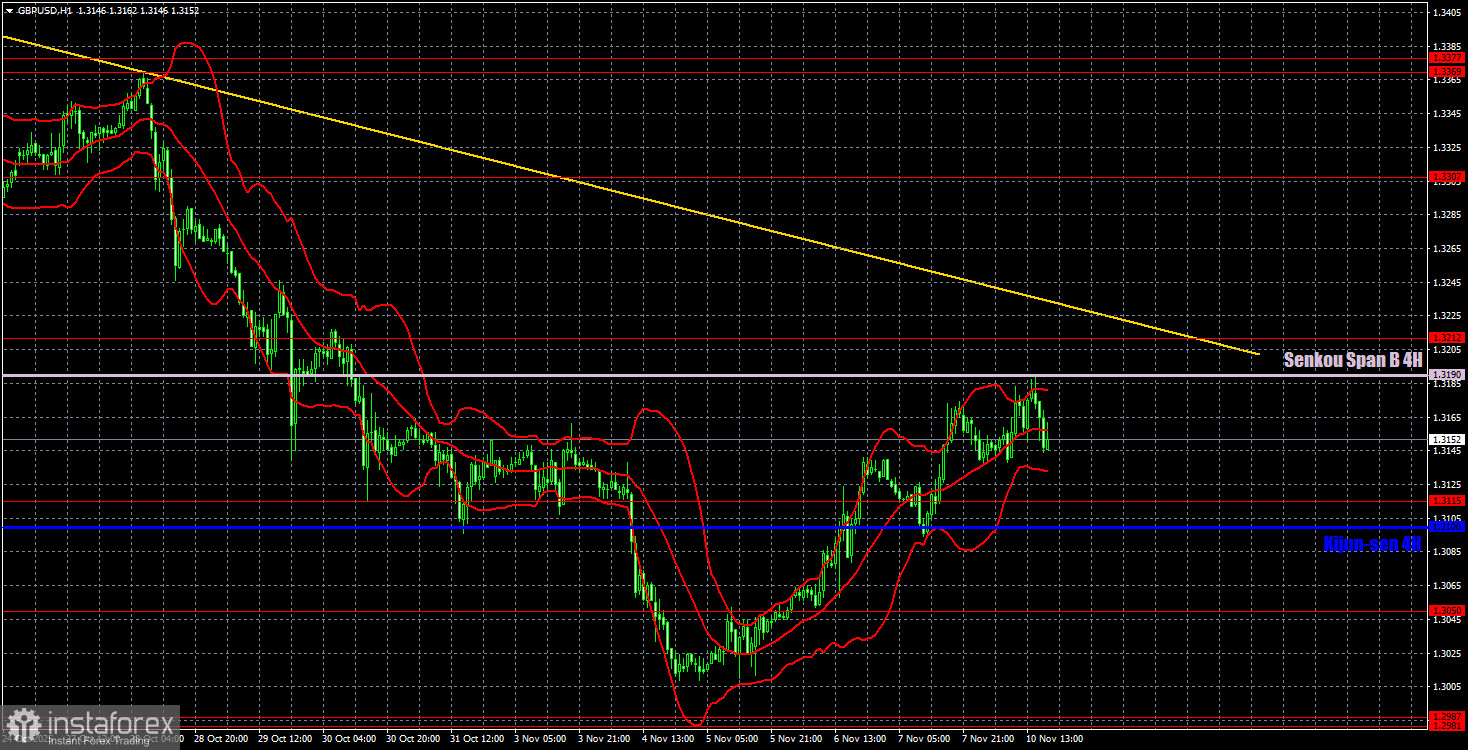
On the hourly timeframe, the GBP/USD pair continues to form a downward trend. The dollar still lacks global reasons to strengthen, so we expect the pair to rise toward the 2025 highs almost regardless of the circumstances. Last week, the price breached the Kijun-sen line, and this week it may attempt to break the trend line and the Senkou Span B line. If this attempt is successful, the trend will shift upward. We believe that growth will continue irrespective of the macroeconomic and fundamental backdrop.
For November 11, we highlight the following important levels: 1.2863, 1.2981-1.2987, 1.3050, 1.3115, 1.3212, 1.3307, 1.3369-1.3377, 1.3420, 1.3533-1.3548, and 1.3584. The Senkou Span B line (1.3190) and the Kijun-sen line (1.3100) can also serve as sources for signals. It is recommended to set a Stop Loss at breakeven when the price moves 20 pips in the correct direction. The lines of the Ichimoku indicator may move during the day, which should be considered when determining trading signals.
On Tuesday, there are no interesting events scheduled in the U.S., but the UK will release unemployment reports, claims for unemployment benefits, and wage data in the morning. These data may provoke a slight market reaction.
Trading Recommendations:
Today, traders can remain in short positions after bouncing off the Senkou Span B line, setting a Stop Loss at breakeven, with targets at 1.3115 and 1.3100. Long positions are recommended upon bouncing off the Kijun-sen line or the 1.3115 level, with a target of 1.3190.
Explanations for Illustrations:
- Support and resistance price levels are shown as thick red lines, near which the movement may end. They are not sources of trading signals.
- Kijun-sen and Senkou Span B lines are lines from the Ichimoku indicator transferred to the hourly timeframe from the 4-hour timeframe. They are strong lines.
- Extreme levels are thin red lines from which the price previously bounced. They are sources of trading signals.
- Yellow lines are trend lines, trend channels, and any other technical patterns.
- Indicator 1 on COT charts represents the size of each category of traders' net position.