 English
  Русский
 Bahasa Indonesia
 Bahasa Malay
 ไทย
ไทย Español
 Deutsch
 Български
 Français
 Tiếng Việt
 中文
中文 বাংলা
বাংলা हिन्दी
 Čeština
 Українська
 Română

Trend Analysis (Fig. 1)
On Wednesday, the market may begin moving upward from the 1.3146 level (yesterday's daily candle close) toward the target of 1.3232 — a historical resistance level (blue dashed line). When testing this level, the price may pull back downward toward 1.3217 — the 21-day EMA (black thin line).
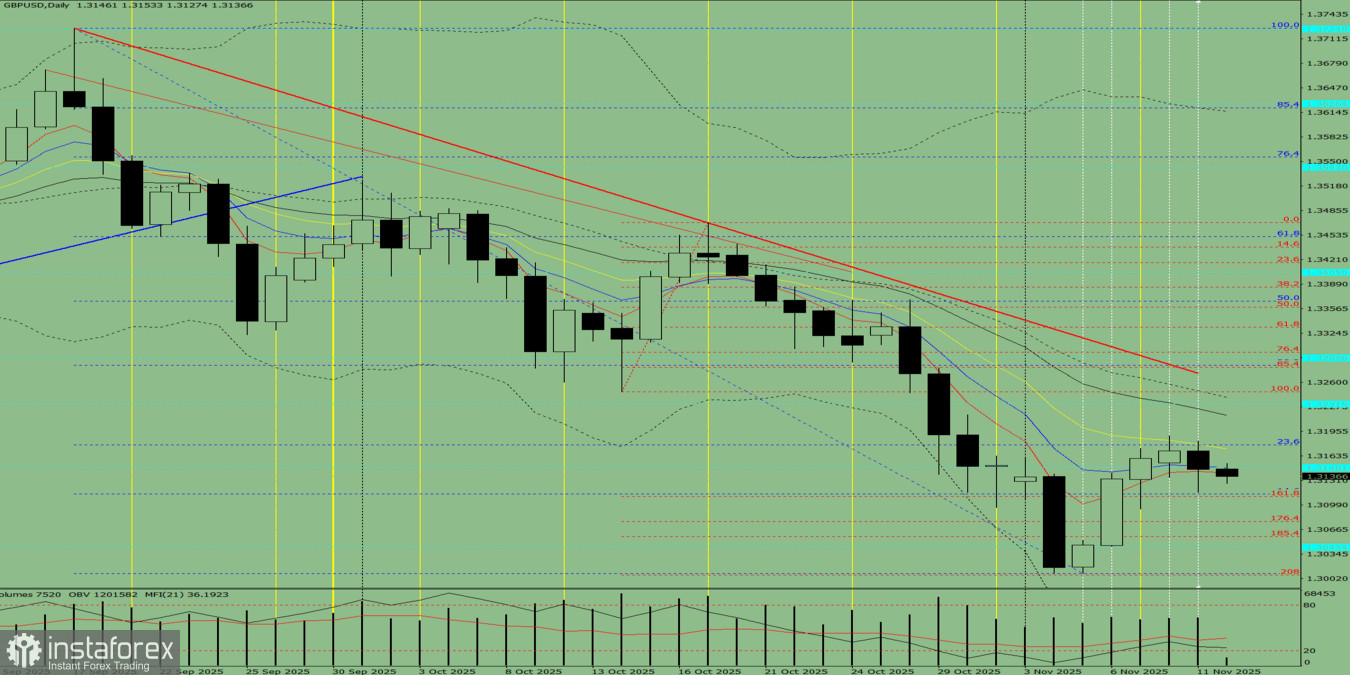
Fig. 1 (Daily Chart)
Comprehensive Analysis
- Indicator analysis – upward;
- Fibonacci levels – upward;
- Volume – upward;
- Candlestick analysis – upward;
- Trend analysis – upward;
- Bollinger Bands – upward;
- Weekly chart – upward.
General conclusion: upward trend.
Alternative Scenario
On Wednesday, the market may begin moving upward from the 1.3146 level (yesterday's daily candle close) toward the target of 1.3217 — the 21-day EMA (black thin line). When testing this line, the price may pull back downward toward 1.3178 — the 23.6% retracement level (blue dashed line).