 English
  Русский
 Bahasa Indonesia
 Bahasa Malay
 ไทย
ไทย Español
 Deutsch
 Български
 Français
 Tiếng Việt
 中文
中文 বাংলা
বাংলা हिन्दी
 Čeština
 Українська
 Română


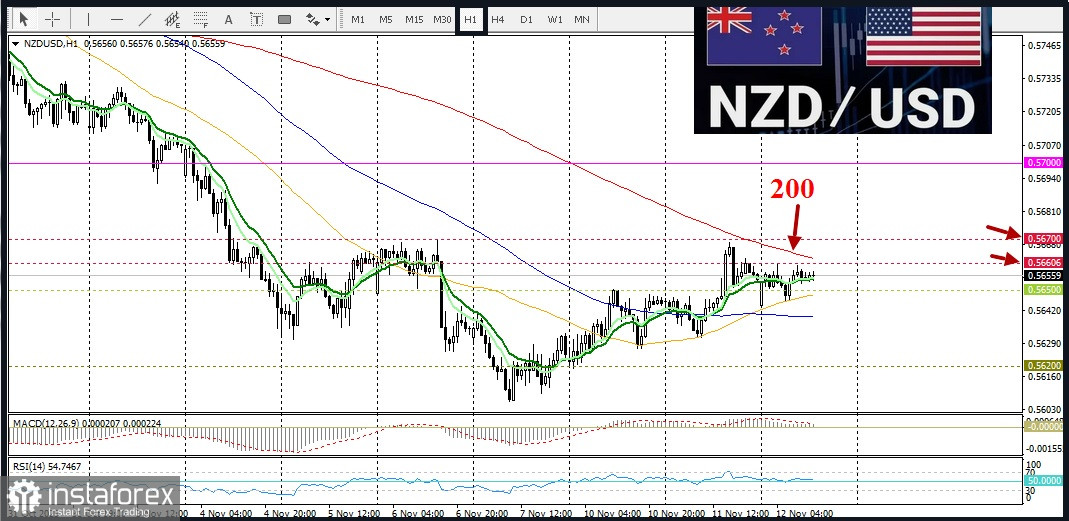
Today, Wednesday, the NZD/USD pair attracted some buying interest. Prices are trading around 0.5650. Yesterday, the pair broke above the 100-hour SMA, indicating that the bulls attempted to stage a recovery. However, it encountered resistance at the 200-hour simple moving average (SMA) and has not yet managed to break through it, which supports the likelihood of a bearish outlook.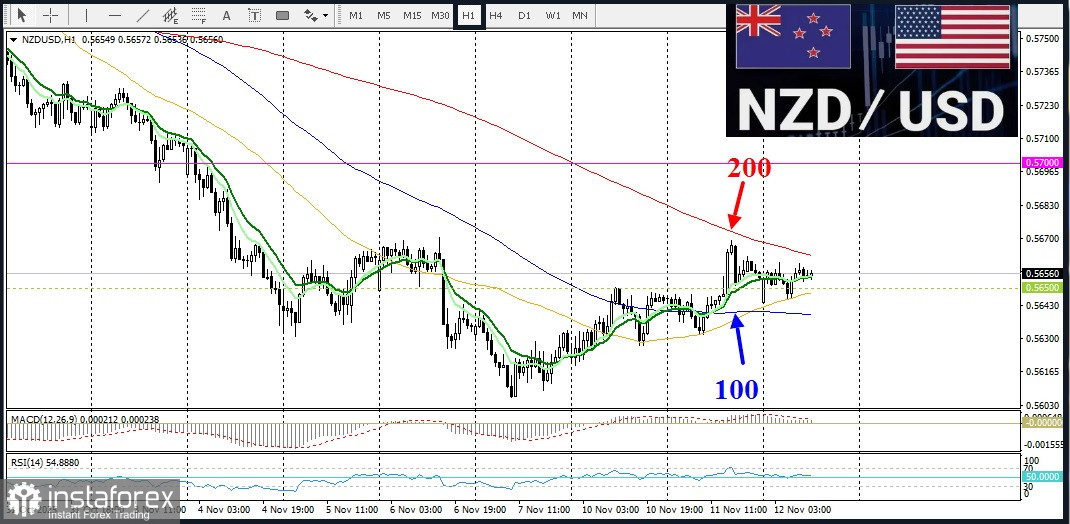
Consequently, further weakness toward the intermediate support level of 0.5625 on the way to the round level of 0.5600 — a level last seen in April — appears likely. A sustained move below the latter level would make the NZD/USD pair vulnerable to an accelerated decline toward 0.5550, before potentially dropping to the next round level of 0.5500, and then to the April low.
On the other hand, the 0.5660–0.5670 level, where the 200-hour SMA is located, remains a strong resistance barrier. A break above this zone, supported by short-covering, could allow the pair to reach the round level of 0.5700.
Further buying beyond that point would open the way for continued upside toward intermediate resistance at 0.5750–0.5755, and ultimately to the round level of 0.5800, which was last observed at the end of October.