 English
  Русский
 Bahasa Indonesia
 Bahasa Malay
 ไทย
ไทย Español
 Deutsch
 Български
 Français
 Tiếng Việt
 中文
中文 বাংলা
বাংলা हिन्दी
 Čeština
 Українська
 Română

The EUR/USD currency pair traded calmly on Wednesday. Throughout the day, there were again no significant messages available to traders, so there was nothing to react to. However, on days when important messages were released, the market also did not rush to actively open positions. Thus, if volatility is at "zero" when the market has "food for thought," what can be expected on days when the macroeconomic and fundamental background is absent?
In our view (which we express almost daily and will continue to do so), the main point at this time is the flatness on the daily timeframe. It is this flatness that explains the weak volatility, illogical local movements, and the market's complete disinterest in information. Let us remind you that over the last two months, the Federal Reserve has lowered the key rate twice, and for the past month and a half, almost all government services and the government have remained non-operational. Such news has had absolutely no impact on the US dollar. The American currency continues to rise. It rises slowly, with constant upward retracements, indicating a corrective status of the downward movement.
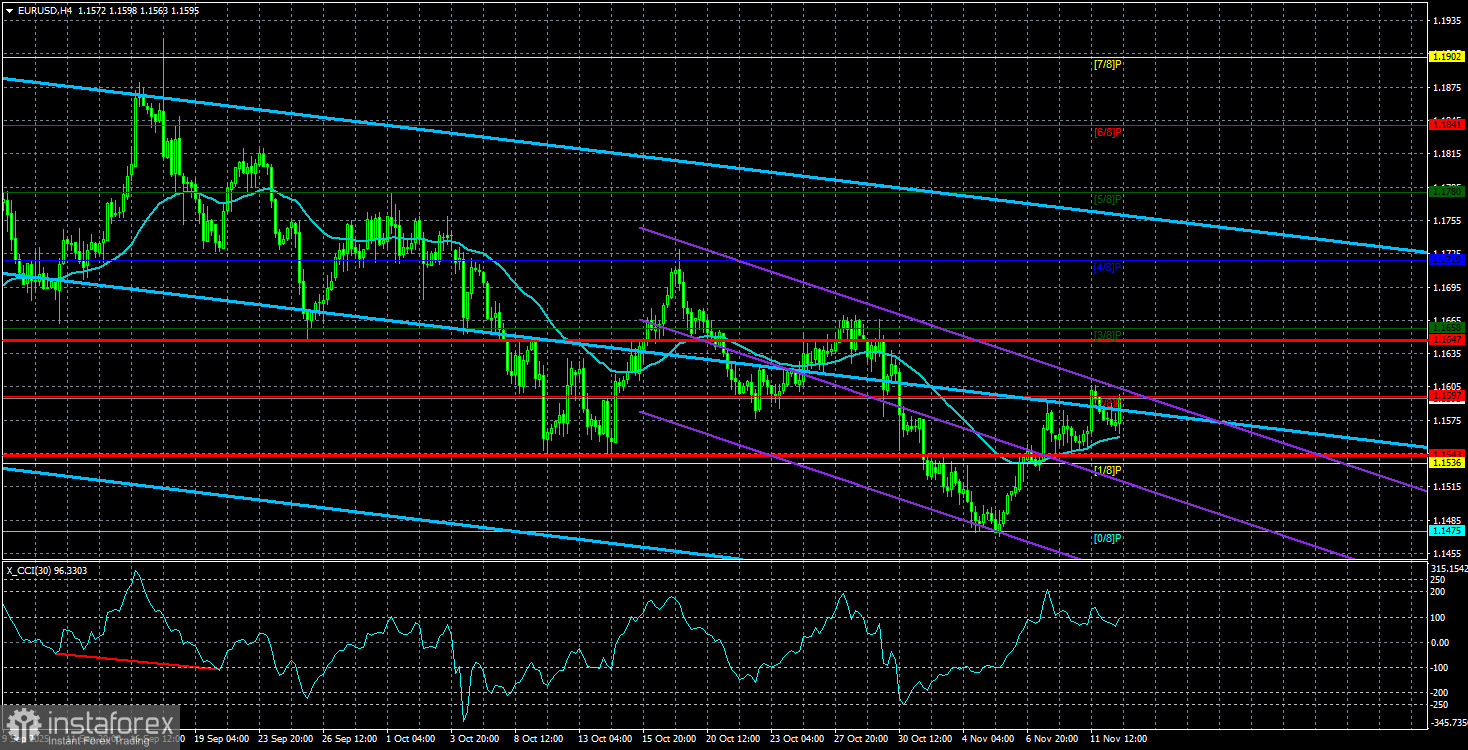
Thus, any decline in the pair is, by default, a correction. The global upward trend for 2025 remains intact. The flat in the area of 1.1400-1.1830 on the daily timeframe is still relevant. So what can we expect next? Certainly not illogical movements. We believe that near the lower boundary of the sideways channel, there will be a reversal upward, after which the upward trend will resume. At that point, local macroeconomic and fundamental factors will not be needed for the pair's new growth. The euro will rise, and analysts will be left puzzled as to why the euro is rising.
Let us recall that, strictly speaking, it is not the euro that has shown growth in 2025. It is the dollar that has declined. The Eurozone itself has very few positive news stories for the European currency. The economy continues to grow relatively slowly; industrial production has been declining steadily for several years; and Trump's trade tariffs are hitting European exporters hard, while the European Central Bank has lowered its key rate eight times. Thus, if it were not for Donald Trump, who became the US president for the second time in January, the European currency would likely have continued to fall as it did for the previous 17 years. At the end of last year, we seriously considered that the euro might drop below parity with the dollar. However, Trump came along and fixed everything. The long-term decline of the dollar can be expected at least because Trump needs a cheap dollar, as he has repeatedly stated eight years ago. We can only wait for the market to emerge from its stupor and for the flat on the daily timeframe to end.
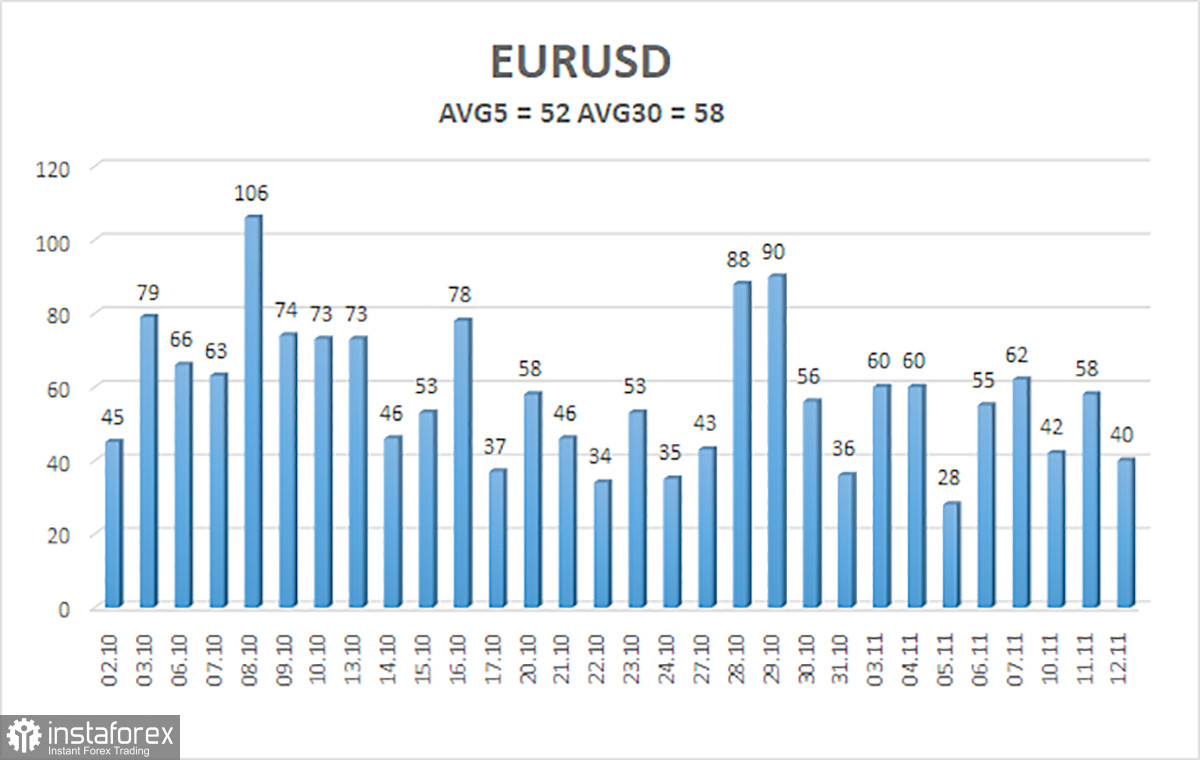
The average volatility of the EUR/USD currency pair over the last five trading days, as of November 13, is 52 pips and is characterized as "low." We expect the pair to trade between 1.1543 and 1.1647 on Thursday. The upper channel of linear regression is directed downwards, signaling a downward trend; nevertheless, a flat continues on the daily timeframe. The CCI indicator entered the oversold area twice in October (!!!), which could provoke a new phase of the upward trend for 2025.
Nearest Support Levels:
S1 – 1.1536
S2 – 1.1475
S3 – 1.1414
Nearest Resistance Levels:
R1 – 1.1597
R2 – 1.1658
R3 – 1.1719
Trading Recommendations:
The EUR/USD pair has once again consolidated above the moving average, maintaining an upward trend across all higher timeframes, while a flat has been ongoing on the daily timeframe for several months. The global fundamental background continues to have a substantial impact on the US dollar. Recently, the dollar has been rising, but the reasons are purely technical. If the price is below the moving average, small short positions with a target of 1.1475 can be considered based purely on technical grounds. Long positions remain relevant above the moving average line, targeting 1.1800 (the upper line of the flat on the daily timeframe).
Explanations for Illustrations:
- Linear regression channels help determine the current trend. If both are directed in the same way, it indicates that the trend is currently strong.
- The moving average line (settings 20,0, smoothed) defines the short-term trend and the direction in which trading should currently be conducted.
- Murray levels are target levels for movements and corrections.
- Volatility levels (red lines) represent the likely price channel in which the pair will spend the following days, based on current volatility indicators.
- The CCI indicator entering the oversold territory (below -250) or overbought territory (above +250) indicates that a trend reversal in the opposite direction is approaching.