 English
  Русский
 Bahasa Indonesia
 Bahasa Malay
 ไทย
ไทย Español
 Deutsch
 Български
 Français
 Tiếng Việt
 中文
中文 বাংলা
বাংলা हिन्दी
 Čeština
 Українська
 Română

Trade Analysis of Thursday:
1H Chart of the EUR/USD Pair
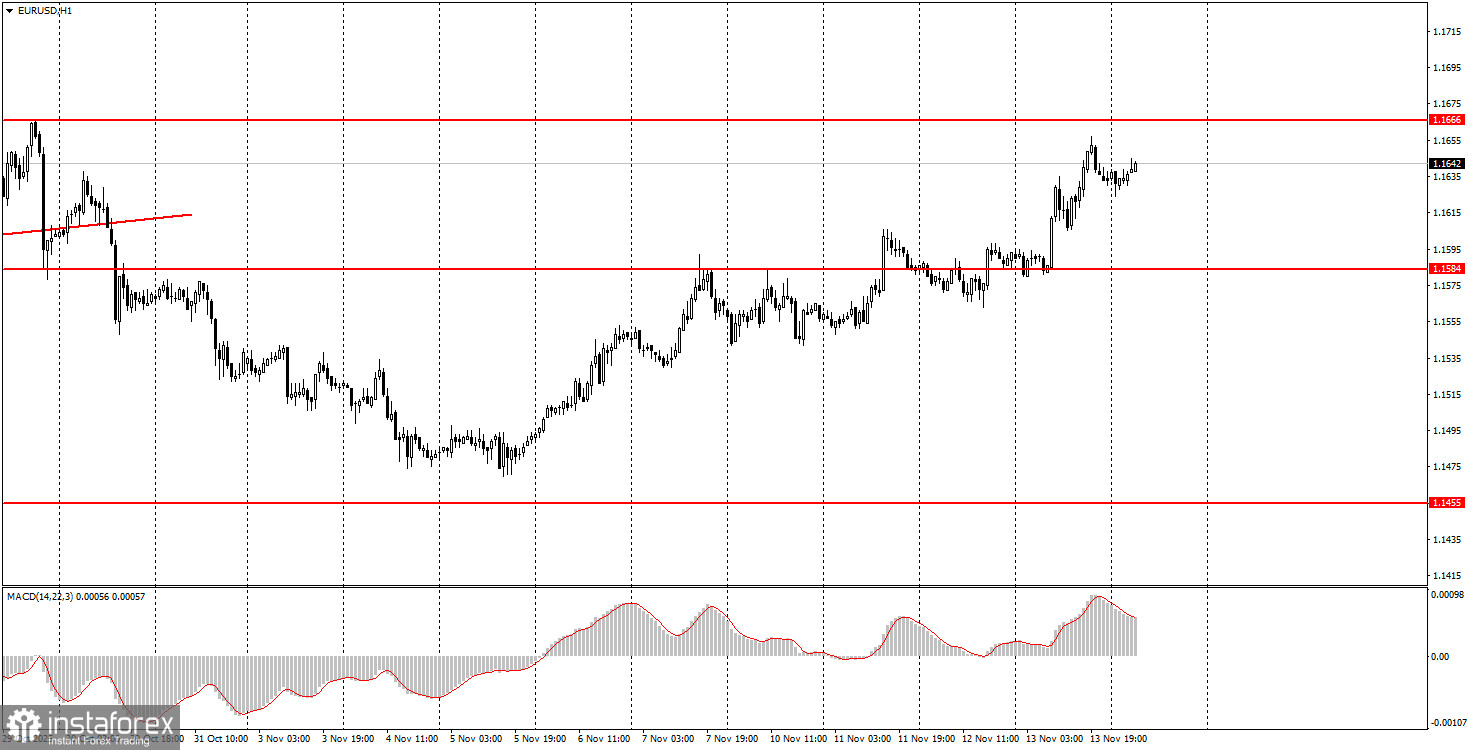
The EUR/USD currency pair continued its upward movement on Thursday, and volatility and strength of the growth even... increased. Novice traders need to remember that the pair's growth indicates a rise in the euro and a fall in the dollar. Thus, the dollar continued its decline yesterday on the news of the end of the US government shutdown. One doesn't need to be an analyst or an expert to see the lack of logic in this movement. Simply put, another important yet local piece of news had no impact on the pair's movement. The market continues to trade as it sees fit, ignoring local macroeconomic and fundamental factors. At the same time, any decline in the pair is, by default, illogical, while any growth is inherently logical, because global fundamental factors remain sharply negative for the dollar. Therefore, in the context of one or two days, considering local macroeconomic and fundamental events, almost all market movements are currently illogical. In terms of global movement and factors, any growth is justified. The daily timeframe remains flat, which explains the illogical movements.
5M Chart of the EUR/USD Pair
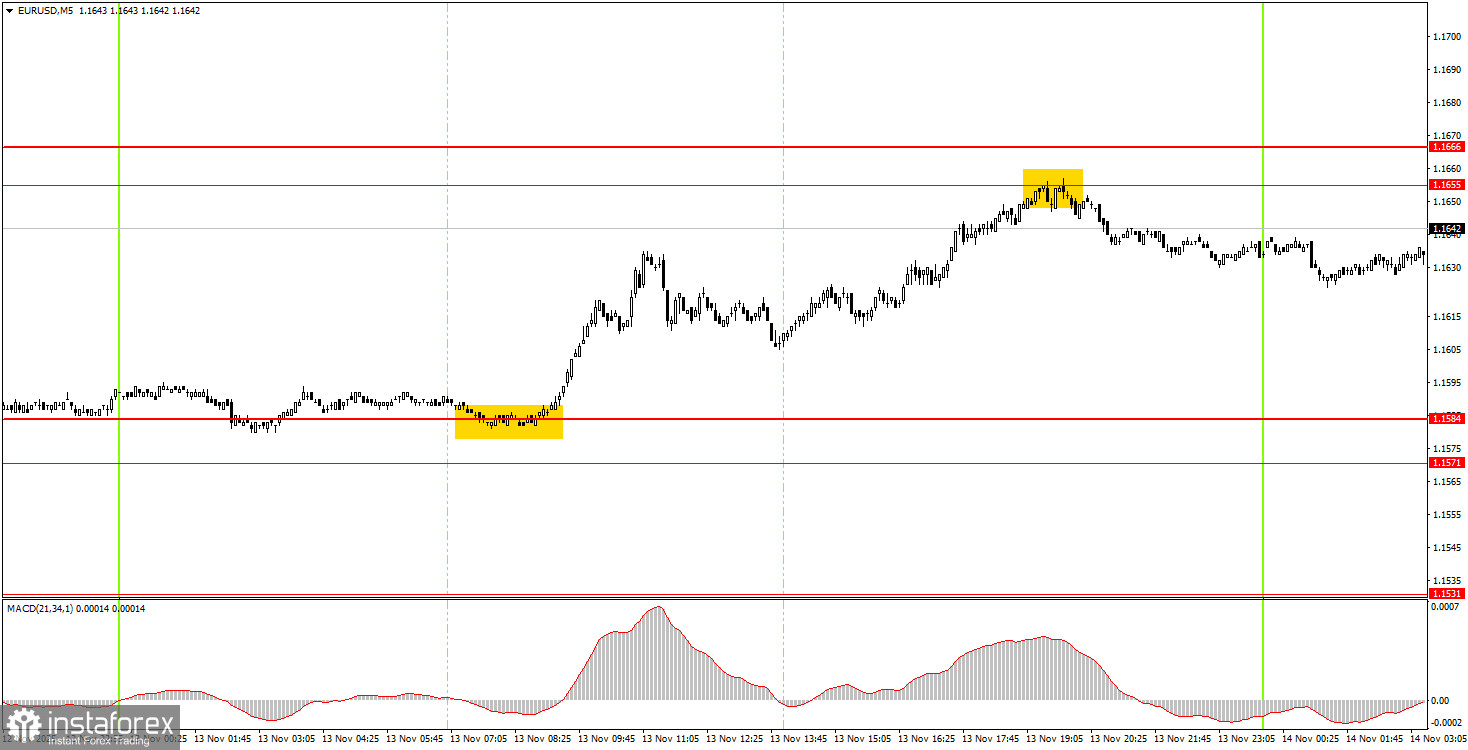
On the 5-minute timeframe, two trading signals were formed on Thursday. At the beginning of the European trading session, the price bounced off the area of 1.1571-1.1584, after which it managed to reach the nearest target - the area of 1.1655-1.1666 - by the end of the day, from which it also bounced. Thus, novice traders had the opportunity to open long positions and secure profits of around 50 pips. The bounce from the 1.1655 level could also have been acted on, but this signal formed fairly late and contradicted the local upward trend.
How to Trade on Friday:
On the hourly timeframe, the EUR/USD pair continues to develop a new local upward trend with the potential for at least 150 more pips. The overall fundamental and macroeconomic background remains very weak for the US dollar. Thus, only on technical grounds can the euro continue its decline – the flat on the daily timeframe remains relevant. However, we expect it to conclude and for the upward trend for 2025 to resume, with some upward movements even within the flat.
On Friday, novice traders can trade in the area of 1.1655-1.1666. A rebound from this area will allow for opening short positions targeting 1.1584. A price consolidation above the 1.1655-1.1666 area will make long positions relevant, targeting 1.1745.
On the 5-minute timeframe, trading levels to consider include 1.1354-1.1363, 1.1413, 1.1455-1.1474, 1.1527-1.1531, 1.1571-1.1584, 1.1655-1.1666, 1.1745-1.1754, 1.1808, 1.1851, 1.1908, 1.1970-1.1988. On Friday, the Q3 GDP report for the Eurozone is scheduled for release, which is essentially the only report of the day. As we remember, local news is almost always ignored by the market, so technical factors remain paramount.
Key Principles of My Trading System:
- The strength of the signal is considered based on the time taken to form the signal (bounce or breach of a level). The less time taken, the stronger the signal.
- If two or more trades have been opened around a certain level based on false signals, all subsequent signals from that level should be ignored.
- In a flat market, any pair can create numerous false signals or may not form them at all. In any case, it's best to stop trading at the first signs of a flat.
- Trading deals are opened during the period between the start of the European session and the middle of the American session, after which all deals should be closed manually.
- On the hourly timeframe, it is preferable to trade based on signals from the MACD indicator only when there is good volatility and a trend that is confirmed by a trend line or trend channel.
- If two levels are too close to each other (between 5 and 20 pips), they should be treated as an area of support or resistance.
- After a 15-pip move in the right direction, a Stop Loss should be set to breakeven.
What the Charts Show:
- Support and resistance price levels are targets for opening buy or sell positions. Take Profit levels can be placed around them.
- Red lines indicate trend channels or trend lines, reflecting the current trend and indicating the preferred trading direction.
- The MACD indicator (14,22,3) — histogram and signal line — is a supplementary indicator that can also be used as a source of signals.
Important announcements and reports (always available in the news calendar) can significantly impact the movement of the currency pair. Therefore, during their release, it is recommended to trade with maximum caution or to exit the market to avoid sharp reversals against the preceding movement.
Beginners trading on the Forex market should remember that not every trade can be profitable. Developing a clear strategy and money management is key to long-term success in trading.