 English
  Русский
 Bahasa Indonesia
 Bahasa Malay
 ไทย
ไทย Español
 Deutsch
 Български
 Français
 Tiếng Việt
 中文
中文 বাংলা
বাংলা हिन्दी
 Čeština
 Українська
 Română

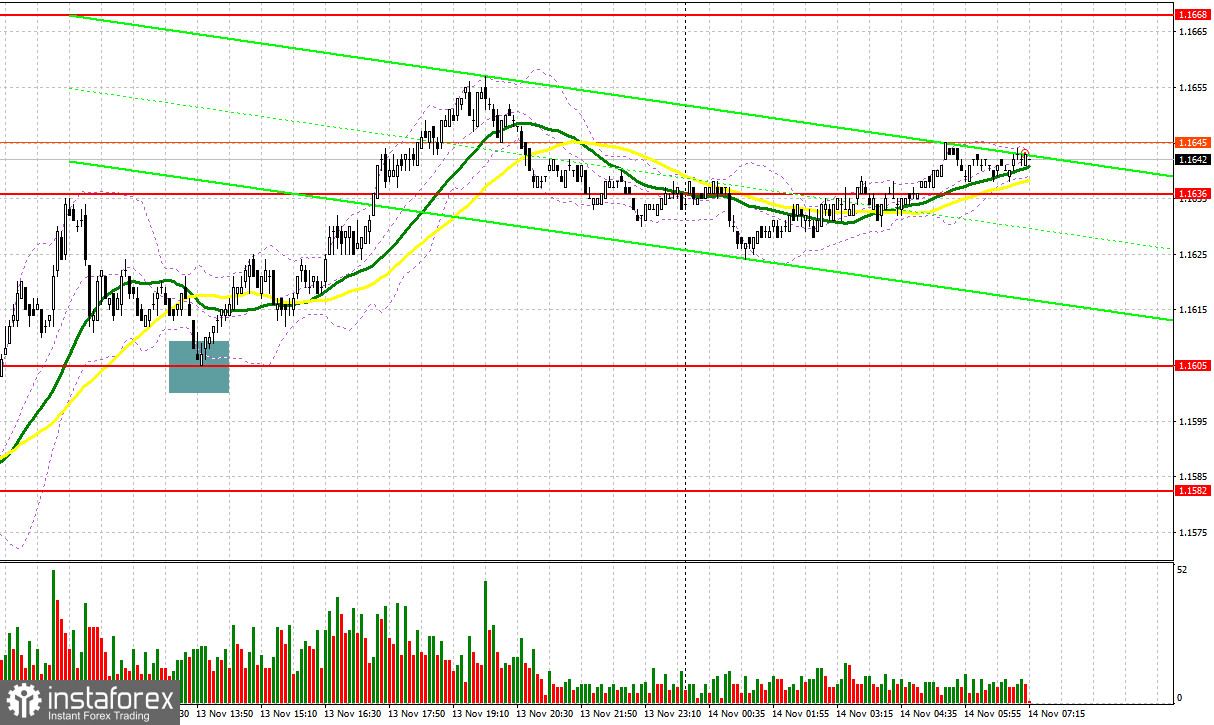
Yesterday, several entry points were established in the market. Let's look at the 5-minute chart and analyze what happened. In my morning forecast, I highlighted the level of 1.1636 and planned to decide whether to enter the market from there. The rise and formation of a false breakout around 1.1636 led to a sell entry for the euro, resulting in a 15-pip decline of the pair. In the afternoon, a false breakout around 1.1605 enabled the establishment of long positions, after which the euro rose by more than 50 pips.
To Open Long Positions for EUR/USD:
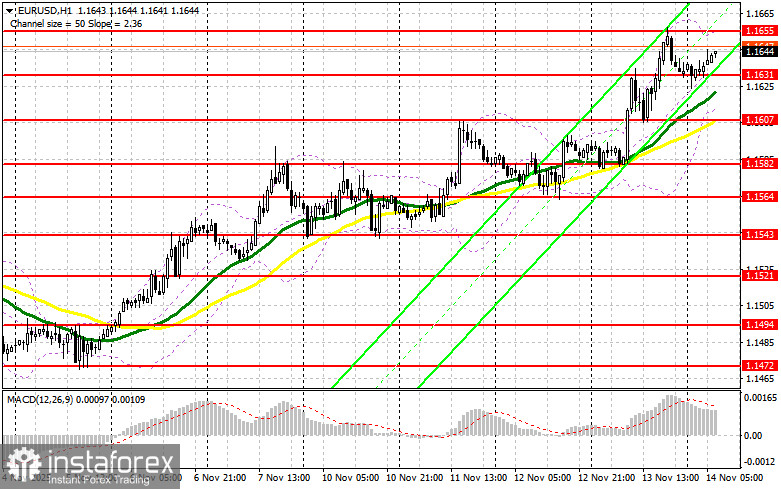
Confusion within the U.S. Federal Reserve regarding what to do next with interest rates is putting pressure on the dollar. Yesterday's statements from Fed representatives significantly differed. Some insisted on pausing the easing cycle, while others called for supporting the economy and the labor market. Today, in the first half of the day, the euro may continue to rise, but strong data on Eurozone GDP growth for the third quarter of this year, changes in employment levels, and the external trade balance are needed to support this. In the event of a negative reaction to the initial data, I expect buyers to emerge around the new support at 1.1631, which formed at the end of yesterday. A false breakout there will provide an entry point for long positions, aiming for further recovery towards the 1.1655 resistance. A breakout and retest of this range will confirm the right decision to buy the euro with the expectation of a larger surge of the pair to 1.1678 – a new weekly high. The furthest target will be the area around 1.1703, where I will take profits. Testing this level will strengthen the euro's bullish market. If there is a decline in EUR/USD and no activity around 1.1631, pressure on the pair will increase, potentially leading to a larger sell-off. Sellers will likely reach the next interesting level at 1.1607. Only the formation of a false breakout there will be an appropriate condition to buy the euro. Long positions will be opened immediately on a rebound from 1.1582, aiming for an upward correction of 30-35 pips within the day.
To Open Short Positions for EUR/USD:
Sellers attempted to resist euro buyers yesterday, but despite statements from Fed officials, the dollar did not gain the necessary support. Today, everything will depend on the Eurozone data. Any positive data will encourage further strengthening of the euro as the bullish market continues, so be cautious with short positions. To prevent a new wave of growth, bears must protect the nearest resistance at 1.1655. Sales there will only be considered upon the formation of a false breakout, providing an entry point for short positions targeting the 1.1631 support, where, slightly below, moving averages that favor buyers are located. A breakout and consolidation below this range, along with a subsequent retest from below, will present another suitable option to open short positions, targeting the area at 1.1607. The furthest target will be around 1.1582, where I will take profits. In the case of an upward move in EUR/USD and no active bearish actions at 1.1655, it is better to postpone short positions until the larger level of 1.1678. Sales there will only be considered after a failed consolidation. I plan to open short positions immediately on a rebound from 1.1703, aiming for a 30-35-pip downward correction.
Recommendation for Reference:
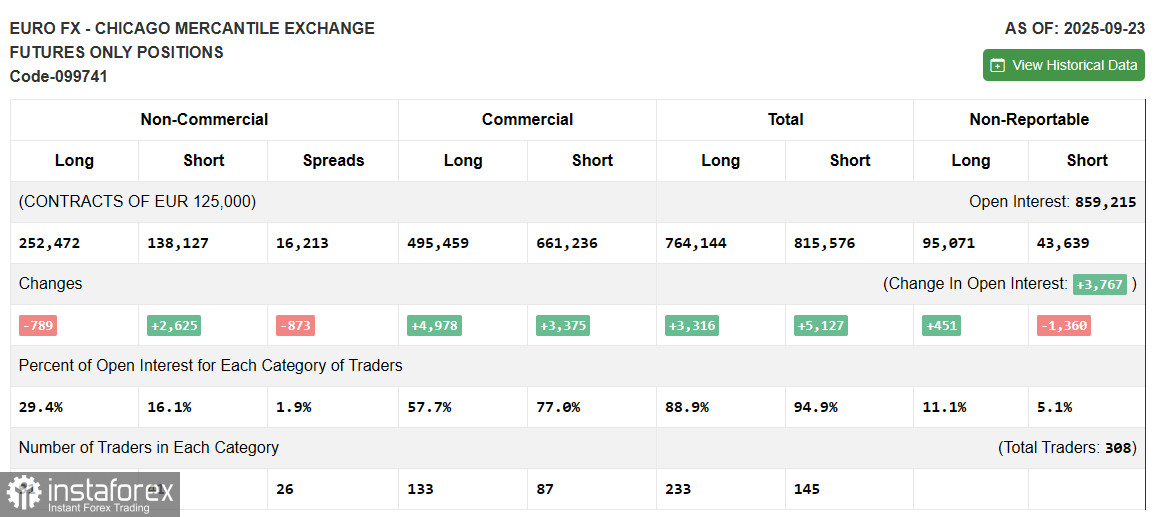
Due to the shutdown in the U.S., fresh data on the Commitment of Traders is not being published. The last data is only relevant as of September 23.
In the COT report (Commitment of Traders) for September 23, there was an increase in short positions and a decrease in long ones. Expectations of further Federal Reserve interest rate cuts continue to put pressure on the U.S. dollar. However, the number of euro buyers is not increasing either, as political issues in France and the risks of new inflation increases compel the ECB to act more cautiously, slowing economic growth. The COT report indicates that long non-commercial positions decreased by 789 to 252,472, while short non-commercial positions increased by 2,625 to 138,625. As a result, the spread between long and short positions decreased by 873.
Indicator Signals:
Moving Averages
Trading is above the 30-day and 50-day moving averages, indicating further euro growth.
Note: The period and prices of the moving averages are considered by the author on the hourly chart (H1) and differ from the general definition of classic daily moving averages on the daily chart (D1).
Bollinger Bands: In the case of a decline, the indicator's lower boundary around 1.1610 will act as support.
Description of Indicators
- Moving average (defines the current trend by smoothing volatility and noise). Period – 50. Marked in yellow on the chart;
- Moving average (defines the current trend by smoothing volatility and noise). Period – 30. Marked in green on the chart;
- MACD indicator (Moving Average Convergence/Divergence). Fast EMA – period 12. Slow EMA – period 26. SMA – period 9;
- Bollinger Bands. Period – 20;
- Non-commercial traders are speculators, such as individual traders, hedge funds, and large institutions using the futures market for speculative purposes and meeting certain requirements;
- Long non-commercial positions represent the total long open position of non-commercial traders;
- Short non-commercial positions represent the total short open position of non-commercial traders;
- Total non-commercial net position is the difference between short and long positions of non-commercial traders.