 English
  Русский
 Bahasa Indonesia
 Bahasa Malay
 ไทย
ไทย Español
 Deutsch
 Български
 Français
 Tiếng Việt
 中文
中文 বাংলা
বাংলা हिन्दी
 Čeština
 Українська
 Română

Looking at the event calendar for the upcoming week for the U.S. dollar, one might get the impression that the "shutdown" is still ongoing. At least, no news has been added to the calendar following its official conclusion. Undoubtedly, the Bureau of Statistics will require considerable time to resume operations and gather all necessary data to compile missing and future reports. However, this does not alleviate the situation for market participants.
The most interesting event of the coming week will be the FOMC minutes, commonly referred to as the "FOMC minutes." I label this event as "the most important" (though it is not truly so) because the remaining reports and events are even less significant to the market. It's worth noting that the FOMC meeting minutes are published several weeks after the actual meeting, when the market has already digested all the information received. Moreover, a lot can change over those few weeks, rendering the reports largely outdated.
In addition to the FOMC minutes, reports on existing home sales, S&P business activity indices for services and manufacturing, and the University of Michigan consumer sentiment index will be released—essentially, that's all. There will not be many other truly significant reports next week, as the Bureau of Statistics has not been functioning for a month and a half. Which of the mentioned reports could change market sentiment, especially when the market has paid little attention to even more important events recently?
Consequently, the wave picture will hold greater significance than the news backdrop in the upcoming week. This means that demand for the U.S. currency may continue to decline moderately.
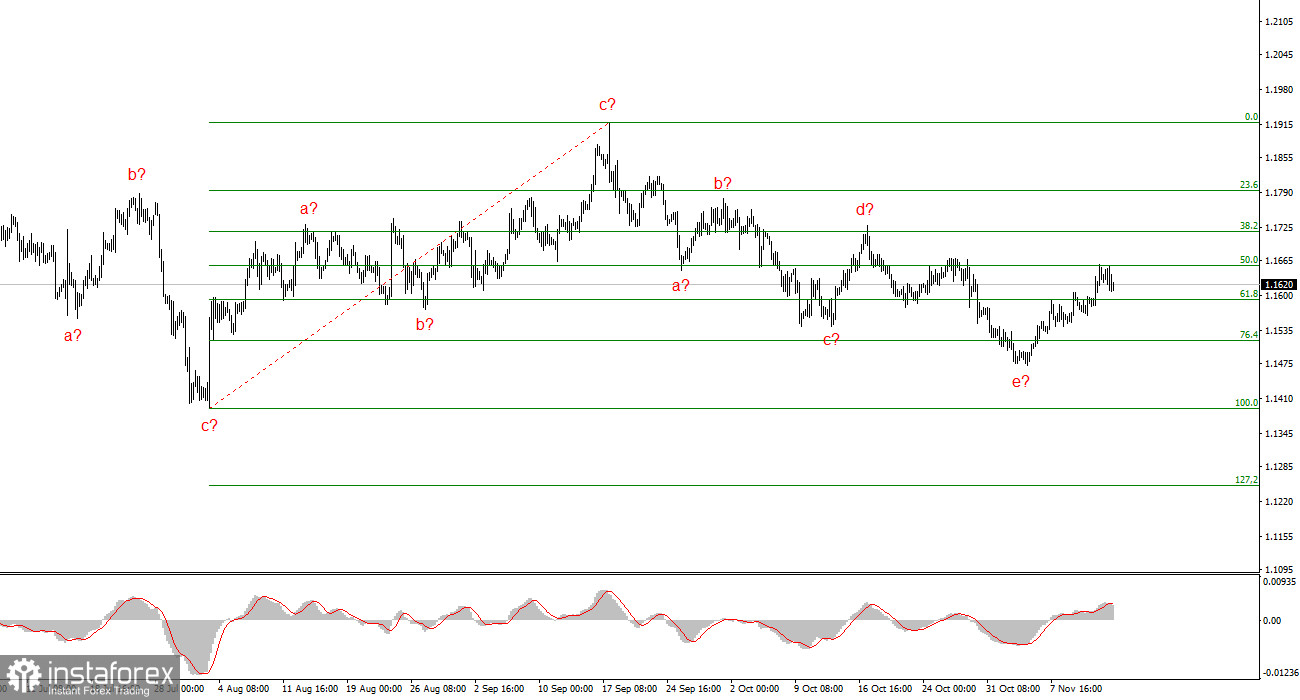
Wave Picture for EUR/USD:
Based on my analysis of EUR/USD, the instrument continues to develop a bullish segment of the trend. In recent months, the market has paused, but Donald Trump's policies and the Federal Reserve remain significant factors that may lead to a decline in the U.S. dollar in the future. The targets for the current segment of the trend could reach the 25 figure. Currently, we are in the construction of corrective wave 4, which is taking a very complex and extended form. Its last internal structure— a-b-c-d-e is presumed to be complete. If this is indeed the case, I expect the instrument to rise with targets around annual highs or near them.
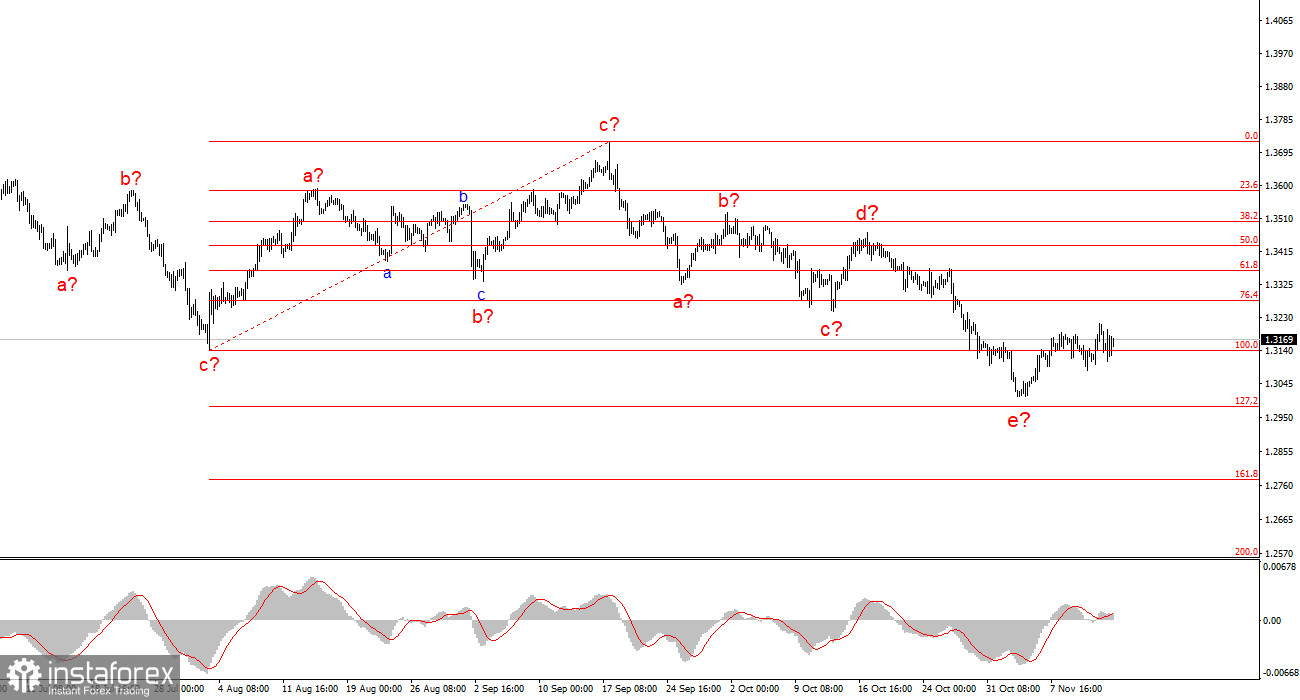
Wave Picture for GBP/USD:
The wave picture for GBP/USD has changed. We continue to deal with a bullish, impulsive segment of the trend, but its internal wave structure has become complex. Wave 4 has taken on a three-wave form, resulting in a very elongated structure. The downward corrective structure a-b-c-d-e in 4 is presumed to be complete. If this is indeed the case, I anticipate that the main wave structure will resume its build-up, with initial targets around the 38 and 40 figures. The key is that the news background needs to be at least a little better than it was this week.
Key Principles of My Analysis:
- Wave structures should be simple and clear. Complex structures are difficult to trade, as they often lead to changes.
- If there's uncertainty in the market, it's better not to enter it.
- There is never 100% certainty in market direction. Always remember to use protective stop-loss orders.
- Wave analysis can be combined with other forms of analysis and trading strategies.