 English
  Русский
 Bahasa Indonesia
 Bahasa Malay
 ไทย
ไทย Español
 Deutsch
 Български
 Français
 Tiếng Việt
 中文
中文 বাংলা
বাংলা हिन्दी
 Čeština
 Українська
 Română

Trade Analysis for Friday:
1H Chart for GBP/USD
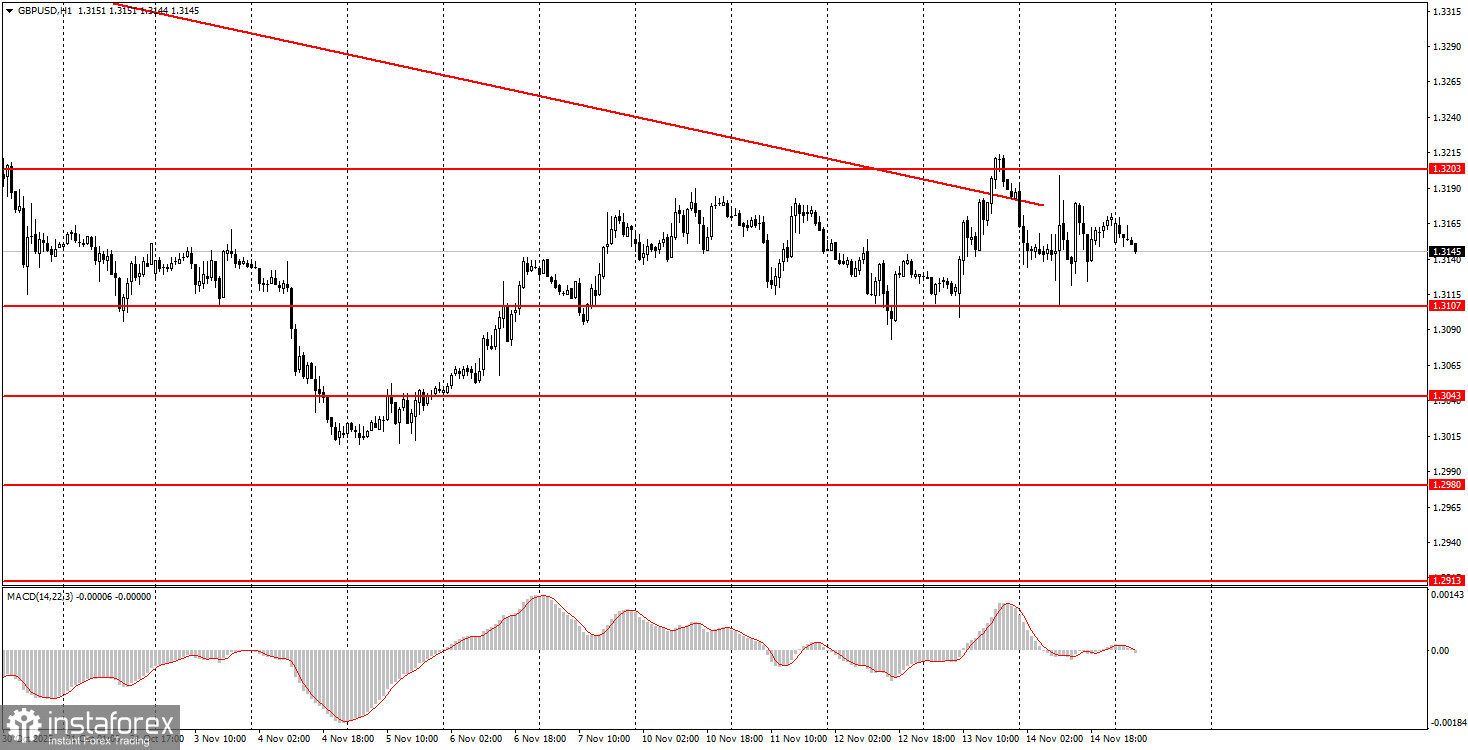
The GBP/USD pair traded sideways on Friday. Over the past week, the British pound failed to mount an upward impulse or to initiate a new decline. The macroeconomic backdrop has not supported the British currency, but it has not shown any significant decline either. The global fundamental backdrop remains sharply unfavorable to the dollar, yet the dollar itself did not decline. The descending trendline has been broken, but the pair has not been able to consolidate above it or the 1.3203 level. A global upward trend remains, but there has been a correction for several consecutive months. In the short term, we can expect the upward movement to continue, provided the pair breaks out of the sideways channel between 1.3107 and 1.3203. Until it trades within this range, trading opportunities will primarily be based on bounces from the channel's boundaries. On Friday, neither the U.S. nor the UK published any significant reports, and none are expected for the rest of the week. The U.S. shutdown has ended, but another one looms.
5M Chart for GBP/USD
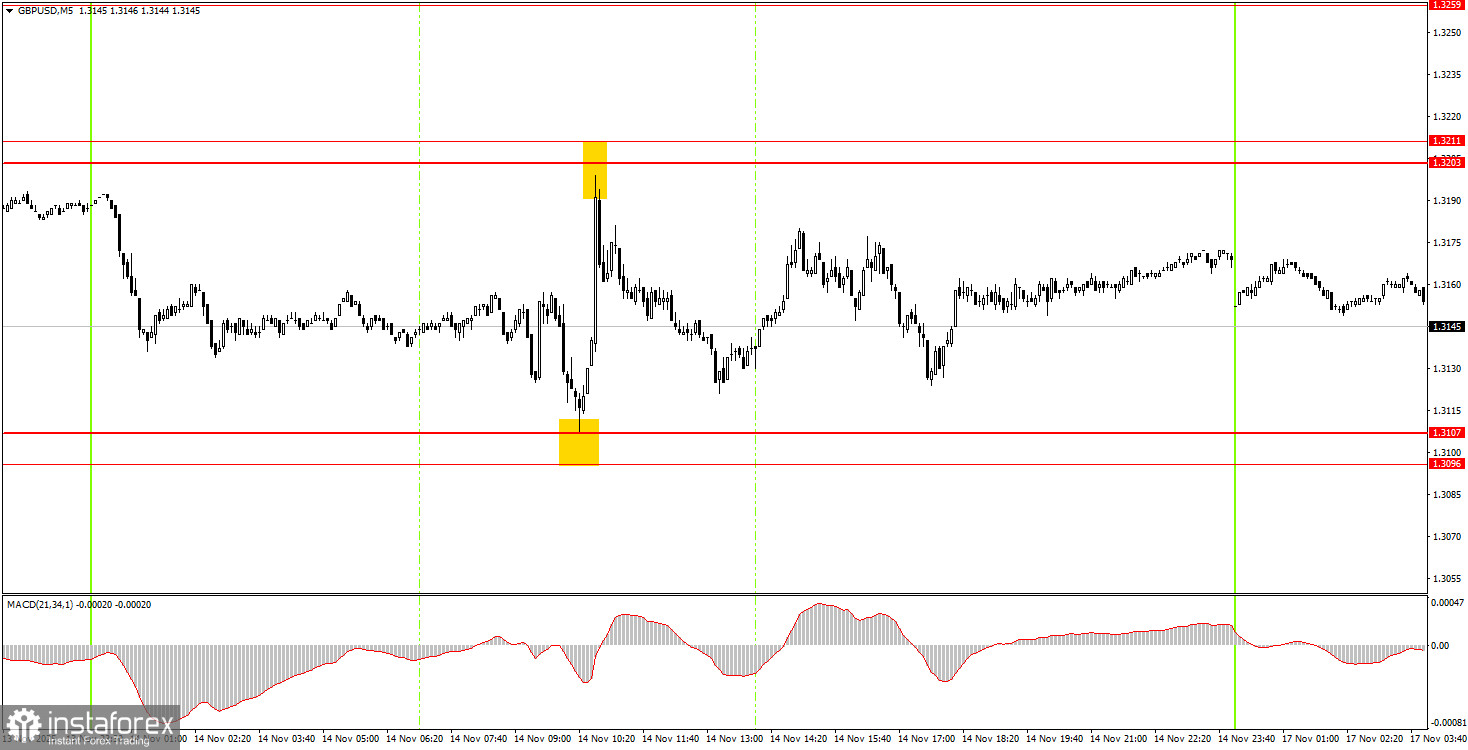
On the hourly timeframe, the GBP/USD pair has broken the trendline, so in the coming weeks, we expect the British currency to rise on any local news or reports. As mentioned, no global factors are driving prolonged dollar strength, so in the medium term, we expect only upward movements. If the correction/flat on the daily timeframe is complete, the pair may resume the global upward trend of 2025. However, we must also wait for the flat to be completed on the hourly timeframe.
On Monday, novice traders can look for new trading signals in the areas of 1.3096–1.3107 and 1.3203–1.3211.
On the 5-minute timeframe, traders can currently operate at the following levels: 1.2913, 1.2980–1.2993, 1.3043, 1.3096–1.3107, 1.3203–1.3211, 1.3259, 1.3329–1.3331, 1.3413–1.3421, 1.3466–1.3475, 1.3529–1.3543, 1.3574–1.3590. On Monday, no significant events or reports are scheduled in the UK or the U.S., suggesting volatility may remain relatively low, and the price is likely to remain within the sideways channel of 1.3107–1.3203.
Key Principles of My Trading System:
- The strength of the signal is considered based on the time taken to form the signal (bounce or breach of a level). The less time taken, the stronger the signal.
- If two or more trades have been opened around a certain level based on false signals, all subsequent signals from that level should be ignored.
- In a flat market, any pair can create numerous false signals or may not form them at all. In any case, it's best to stop trading at the first signs of a flat.
- Trading deals are opened during the period between the start of the European session and the middle of the American session, after which all deals should be closed manually.
- On the hourly timeframe, it is preferable to trade based on signals from the MACD indicator only when there is good volatility and a trend that is confirmed by a trend line or trend channel.
- If two levels are too close to each other (between 5 and 20 pips), they should be treated as an area of support or resistance.
- After a 20-pip move in the right direction, a Stop Loss should be set to breakeven.
What the Charts Show:
- Support and resistance price levels are targets for opening buy or sell positions. Take Profit levels can be placed around them.
- Red lines indicate trend channels or trend lines, reflecting the current trend and indicating the preferred trading direction.
- The MACD indicator (14,22,3) — histogram and signal line — is a supplementary indicator that can also be used as a source of signals.
Important announcements and reports (always available in the news calendar) can significantly impact the movement of the currency pair. Therefore, during their release, it is recommended to trade with maximum caution or to exit the market to avoid sharp reversals against the preceding movement.
Beginners trading on the Forex market should remember that not every trade can be profitable. Developing a clear strategy and money management is key to long-term success in trading.