 English
  Русский
 Bahasa Indonesia
 Bahasa Malay
 ไทย
ไทย Español
 Deutsch
 Български
 Français
 Tiếng Việt
 中文
中文 বাংলা
বাংলা हिन्दी
 Čeština
 Українська
 Română

Trend Analysis
This week, from the level of 1.3169 (the close of the latest weekly candle), the price may continue moving downward toward 1.2942 – the 50% retracement level (red dashed line). Upon testing this level, the price may pull back upward toward 1.3044 – the historical support level (blue dashed line).
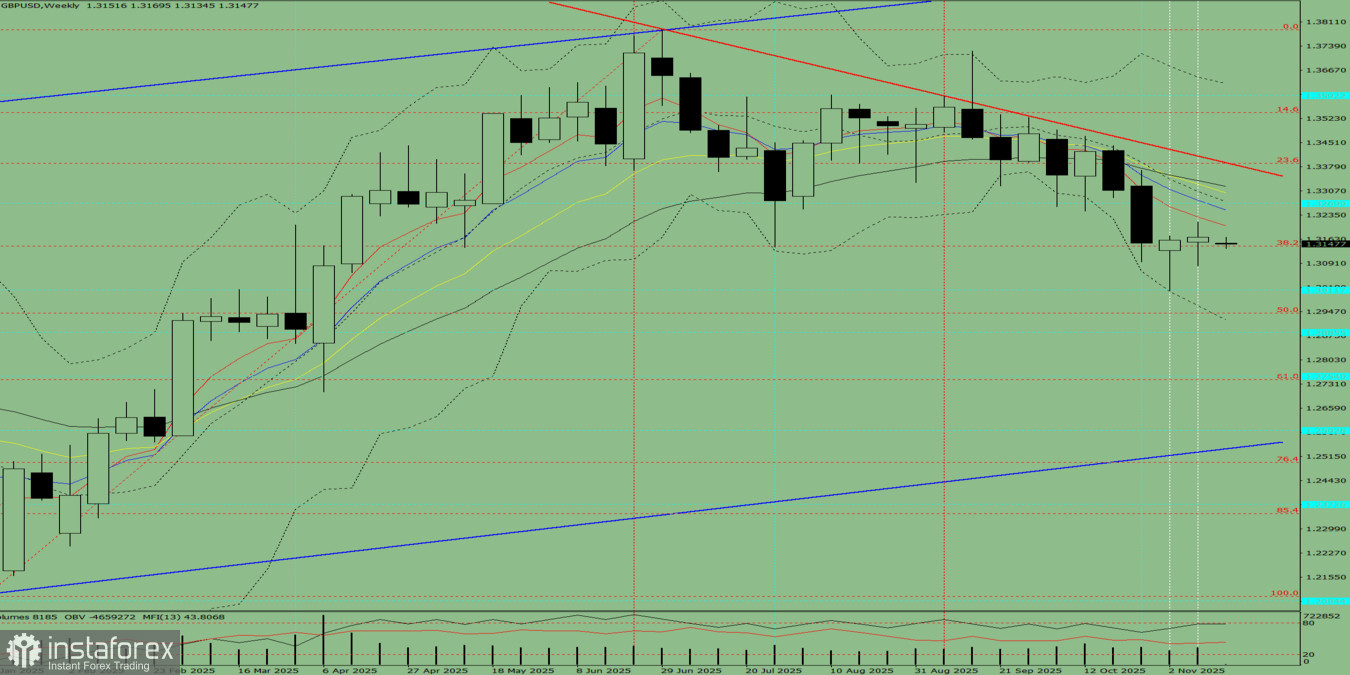
Fig. 1 (weekly chart).
Comprehensive Analysis:
- indicator analysis – downward
- Fibonacci levels – downward
- volumes – downward
- candlestick analysis – downward
- trend analysis – downward
- Bollinger Bands – downward
- monthly chart – downward
Final Summary of the Weekly Candle Projection for GBP/USD:
During the week, the price will most likely show a downward trend, with no upper shadow on the weekly black candle (Monday – downward) and the presence of a lower shadow (Friday – upward).
Alternative Scenario:
From the level of 1.3169 (the close of the latest weekly candle), the price may continue moving downward toward 1.3012 – the historical support level (blue dashed line). Upon reaching this level, the price may move upward toward 1.3083 – the lower fractal (weekly candle from November 2, 2025).