 English
  Русский
 Bahasa Indonesia
 Bahasa Malay
 ไทย
ไทย Español
 Deutsch
 Български
 Français
 Tiếng Việt
 中文
中文 বাংলা
বাংলা हिन्दी
 Čeština
 Українська
 Română


The EUR/USD currency pair traded with low volatility on Monday, showing a complete lack of desire to move in either direction. Overall, we have been drawing traders' attention to several very important technical points for several weeks now. It may seem that we have completely forgotten about the macroeconomic or fundamental background, but that is not the case. Let's understand why.
Firstly, the fundamental background has been ignored by the market for the past month and a half. Let's recall that the dollar rose by 300 pips during the US "shutdown". It then calmly continued (the previously started) decline when the "shutdown" officially ended. Additionally, during that same period, the dollar was rising amid the Federal Reserve's monetary policy easing, and now, when the Fed has almost abandoned rate cuts in December, it is calmly falling. We should also not forget about Donald Trump's tariffs. The last package was introduced in early October, impacting all imports of trucks, medicines, and furniture. Shortly thereafter, tariffs for India increased to 50%. All this did not prevent the dollar from rising throughout October. Thus, we can say that the market has not yet recognized the fundamental background.
Secondly, the most important macroeconomic data is currently absent. Economic data from the Eurozone (on inflation or unemployment) is indeed important, but American data have always remained a priority for traders. Moreover, the European Central Bank has effectively completed its monetary policy easing cycle, so the market's attention has shifted to the Fed. The Fed's decisions depend on macroeconomic data, which is currently lacking. Therefore, secondary reports that are still published from time to time occasionally catch the traders' attention, but in general, macroeconomics has very little influence on the pair's movements.
Thus, only technical analysis remains, and here everything is straightforward and predictable. We repeatedly note the flat on the daily timeframe, as it is precisely because of this that we observe the movements we see. The EUR/USD pair has been trading in a sideways channel between 1.1400 and 1.1830 for several months, and price fluctuations within the flat are typically random. This is why the fundamentals and macroeconomics do not correspond to the pair's movements. The price moves classically within the sideways channel – from one boundary to the other. Just a week ago, the price dropped to the level of 1.1470, meaning it was near the lower boundary of the flat. That is why the upward reversal occurred, and now we are observing the pair's growth.
We remind you that any drop in the European currency at this time is, a priori, a correction and does not correspond to the fundamentals or macroeconomics. Any rise is entirely justified due to global factors that remain in effect. The flat will eventually end, and a new phase of the 2025 upward trend will begin with a slight move. Therefore, we would not be surprised if this phase has already begun at 1.1470. So far, it is a very weak movement within the flat, but "Rome wasn't built in a day."
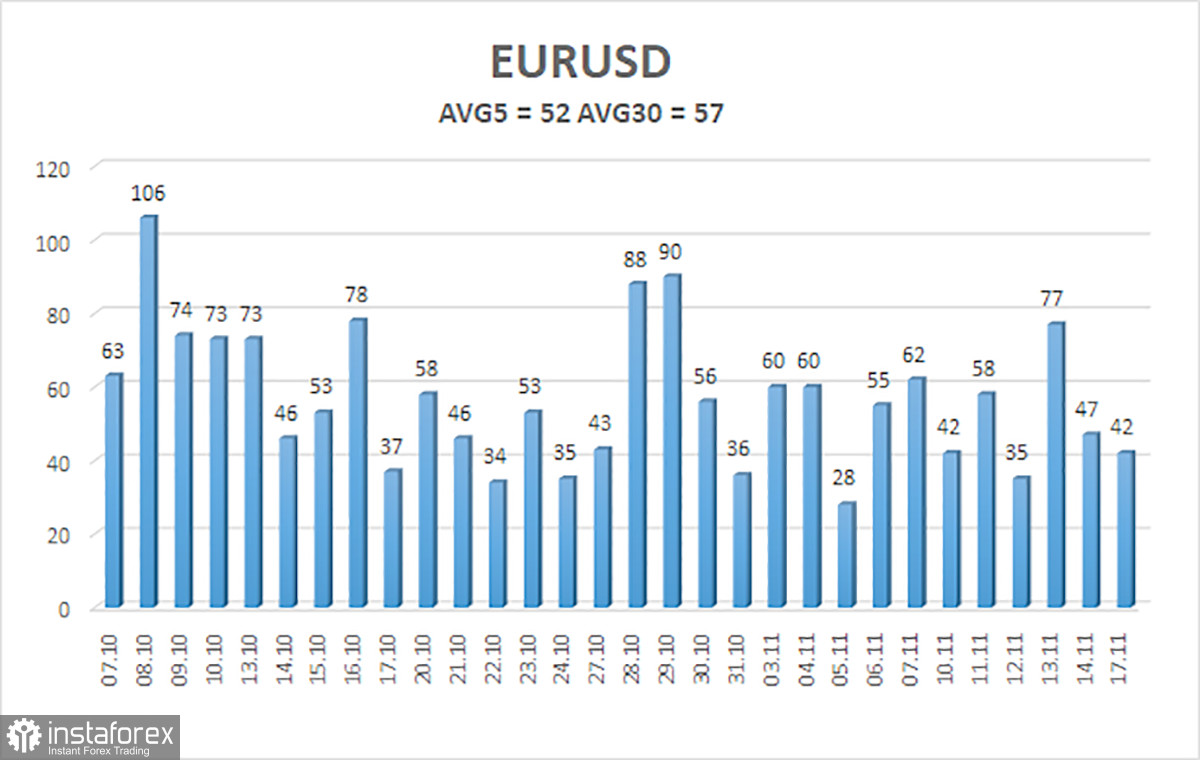
The average volatility of the EUR/USD currency pair over the last 5 trading days as of November 18 is 52 pips, which is considered "average." We expect the pair to trade between 1.1543 and 1.1647 on Tuesday. The higher channel of the linear regression is downward, signaling a bearish trend, but in fact, a flat continues on the daily timeframe. The CCI indicator entered the oversold territory twice in October, which may provoke a new phase of the upward trend for 2025.
Nearest Support Levels:
- S1 – 1.1597
- S2 – 1.1536
- S3 – 1.1475
Nearest Resistance Levels:
- R1 – 1.1658
- R2 – 1.1719
- R3 – 1.1780
Trading Recommendations:
The EUR/USD pair has once again solidified above the moving average, and the upward trend remains intact across all higher timeframes, although a flat has been ongoing on the daily timeframe for several months. The global fundamental background continues to exert a strong influence on the American currency. Recently, the dollar has been rising, but the reasons for this movement may be purely technical. With the price positioned below the moving average, small short positions can be considered with a target of 1.1536 based purely on technical grounds. Above the moving average, long positions remain relevant with a target of 1.1800 (the upper line of the flat on the daily timeframe).
Explanations for Illustrations:
- Linear regression channels help determine the current trend. If both are directed in the same way, it indicates that the trend is currently strong.
- The moving average line (settings 20,0, smoothed) defines the short-term trend and the direction in which trading should currently be conducted.
- Murray levels are target levels for movements and corrections.
- Volatility levels (red lines) represent the likely price channel in which the pair will spend the following days, based on current volatility indicators.
- The CCI indicator entering the oversold territory (below -250) or overbought territory (above +250) indicates that a trend reversal in the opposite direction is approaching.