 English
  Русский
 Bahasa Indonesia
 Bahasa Malay
 ไทย
ไทย Español
 Deutsch
 Български
 Français
 Tiếng Việt
 中文
中文 বাংলা
বাংলা हिन्दी
 Čeština
 Українська
 Română

Monday's Trade Breakdown:
1H Chart of the EUR/USD Pair
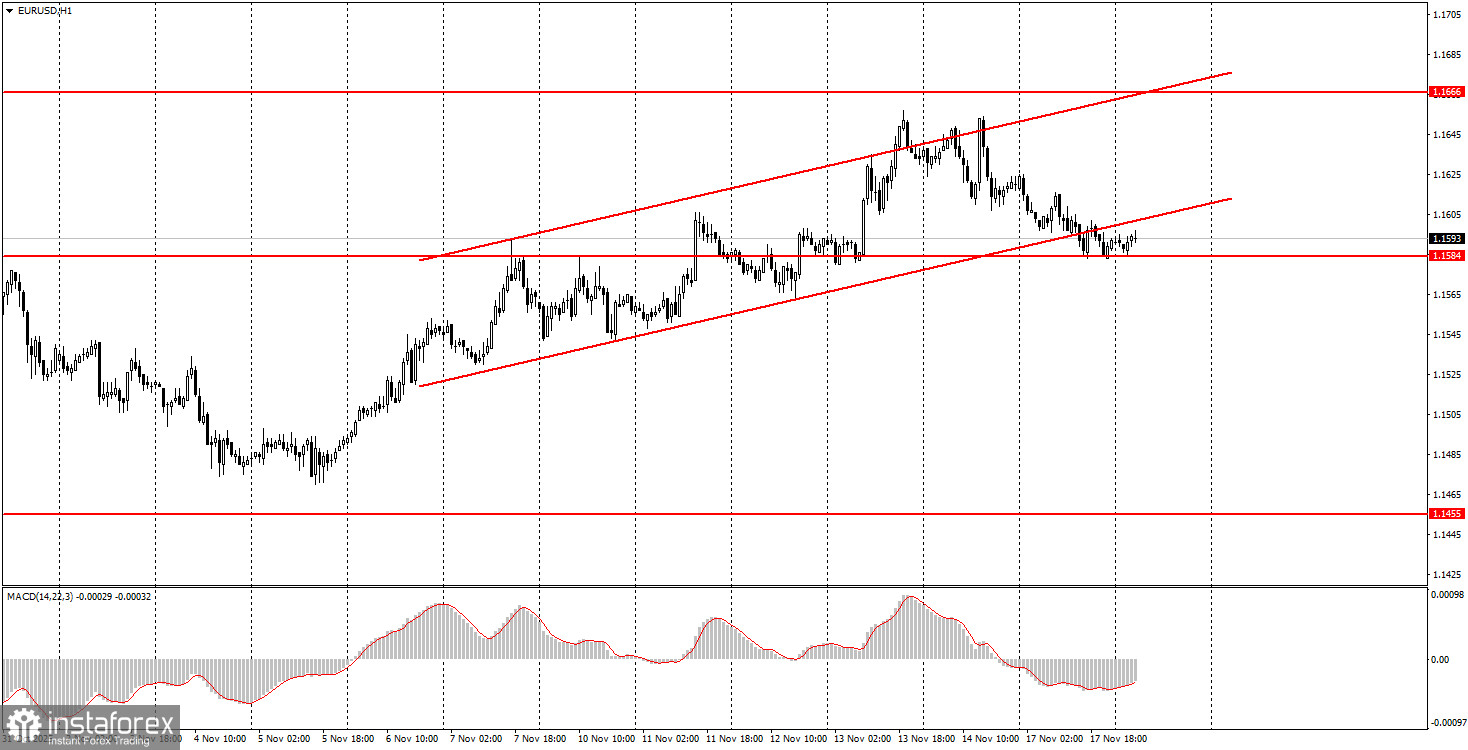
The EUR/USD currency pair traded very weakly on Monday. No macroeconomic or fundamental events were scheduled for the first trading day of the week, so the minimal volatility is not surprising. The market has been trading very sluggishly in recent weeks and months, and the daily timeframe (as a reminder) continues to show flat movement, which we consider a key point in analyzing the EUR/USD pair. We understand that traders (especially beginners) want to make trades and earn profits every day. However, it is essential to recognize that periods of flat trading and news lulls occur in the market. Of course, it's up to each individual to decide how to act during such periods. One can also trade and profit during flat conditions. It is crucial to understand that it is currently extremely difficult to expect even 60 pips of movement intraday. On average, the pair trades within 40-50 pips, which provides maximum potential profit per trade with perfect market entry of about 20 pips.
5M Chart of the EUR/USD Pair
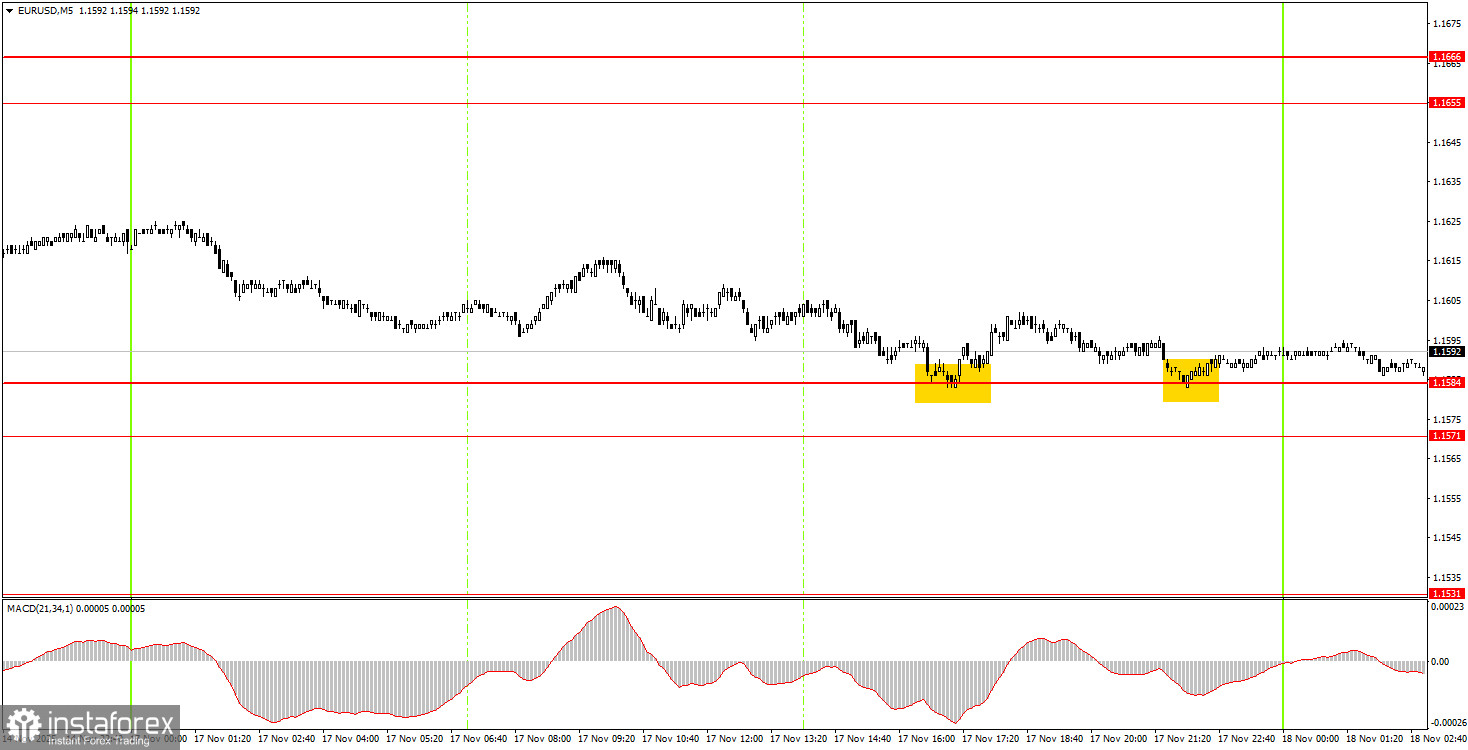
On the 5-minute timeframe on Monday, two trading signals were formed. By the end of the day, the price reached the level of 1.1584, bouncing off it twice, if these "twists" can even be called a "bounce." Nevertheless, today the pair may bounce off this level or even the 1.1571-1.1584 area and move up by about 30-40 pips.
How to Trade on Tuesday:
On the hourly timeframe, the EUR/USD pair continues to form a new local upward trend with potential growth of another 150-200 pips. The overall fundamental and macroeconomic backdrop remains very weak for the U.S. dollar. Thus, the European currency may only show declines based on technical reasons – the flat on the daily timeframe remains relevant. However, we expect its completion and a resumption of the upward trend for 2025, and within the flat, there can also be upward movements.
On Tuesday, novice traders may trade from the area of 1.1571-1.1584. A third bounce from this area will allow for long positions with a target of 1.1655. A price consolidation below the area of 1.1571-1.1584 will make short positions relevant with a target of 1.1534.
On the 5-minute timeframe, the following levels should be considered: 1.1354-1.1363, 1.1413, 1.1455-1.1474, 1.1527-1.1531, 1.1571-1.1584, 1.1655-1.1666, 1.1745-1.1754, 1.1808, 1.1851, 1.1908, 1.1970-1.1988. On Tuesday, no major reports or events are scheduled in Europe or the U.S. Therefore, it is likely that sideways movement will predominate today, with low volatility.
Key Principles of My Trading System:
- The strength of the signal is considered based on the time taken to form the signal (bounce or breach of a level). The less time taken, the stronger the signal.
- If two or more trades have been opened around a certain level based on false signals, all subsequent signals from that level should be ignored.
- In a flat market, any pair can create numerous false signals or may not form them at all. In any case, it's best to stop trading at the first signs of a flat.
- Trading deals are opened during the period between the start of the European session and the middle of the American session, after which all deals should be closed manually.
- On the hourly timeframe, it is preferable to trade based on signals from the MACD indicator only when there is good volatility and a trend that is confirmed by a trend line or trend channel.
- If two levels are too close to each other (between 5 and 20 pips), they should be treated as an area of support or resistance.
- After a 15-pip move in the right direction, a Stop Loss should be set to breakeven.
What the Charts Show:
- Support and resistance price levels are targets for opening buy or sell positions. Take Profit levels can be placed around them.
- Red lines indicate trend channels or trend lines, reflecting the current trend and indicating the preferred trading direction.
- The MACD indicator (14,22,3) — histogram and signal line — is a supplementary indicator that can also be used as a source of signals.
Important announcements and reports (always available in the news calendar) can significantly impact the movement of the currency pair. Therefore, during their release, it is recommended to trade with maximum caution or to exit the market to avoid sharp reversals against the preceding movement.
Beginners trading on the Forex market should remember that not every trade can be profitable. Developing a clear strategy and money management is key to long-term success in trading.