 English
  Русский
 Bahasa Indonesia
 Bahasa Malay
 ไทย
ไทย Español
 Deutsch
 Български
 Français
 Tiếng Việt
 中文
中文 বাংলা
বাংলা हिन्दी
 Čeština
 Українська
 Română

Trade Analysis and Recommendations for the Japanese Yen
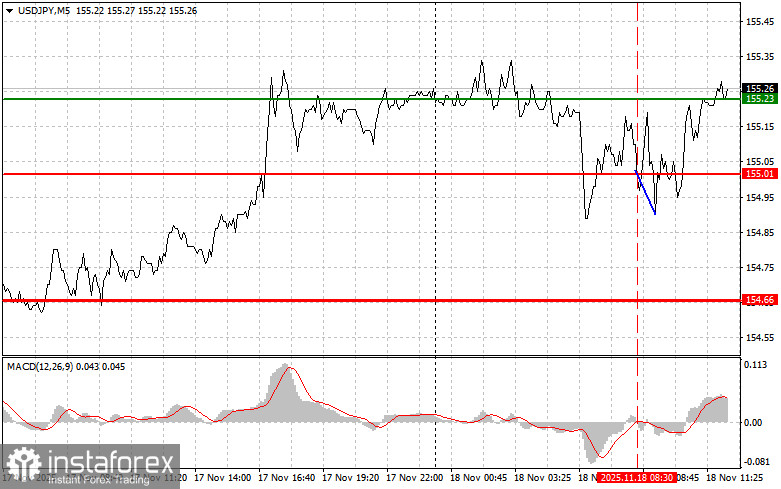
The price test at 155.01 occurred when the MACD indicator had just begun moving downward from the zero line, confirming a correct sell-entry point for the dollar. However, a significant decline in the pair did not occur during the first half of the day.
In the second half of the day, market focus will shift to the NAHB U.S. Housing Market Index and data on changes in industrial orders. Additionally, speeches by FOMC members Michael Barr and Thomas Barkin are expected. Hawkish statements from the regulators could potentially push the dollar higher. If the NAHB index shows further deterioration in builder sentiment, it may put pressure on the U.S. dollar. A decline in manufacturing orders will also be interpreted as a sign of slowing growth in the industrial sector, which in turn may intensify pressure on the dollar.
Speeches by Barr and Barkin will be among the key events. They are likely to emphasize the need to maintain tight monetary policy, considering current inflation levels and the labor market. Any signals supporting the idea of keeping interest rates elevated for longer than expected could lead to dollar strengthening, weakening the Japanese yen.
As for the intraday strategy, I will rely mostly on scenarios No. 1 and No. 2.
Buy Signal
Scenario No. 1: Today, I plan to buy USD/JPY at the entry level around 155.39 (green line on the chart), targeting a rise to 155.83 (thicker green line on the chart). Near 155.83, I will exit buy positions and open sell trades in the opposite direction (expecting a 30–35 point retracement). Growth in the pair can be expected as part of the continuing bullish market. Important! Before buying, make sure the MACD indicator is above the zero line and just beginning to rise from it.
Scenario No. 2: I also plan to buy USD/JPY today in the event of two consecutive tests of the 155.13 level while the MACD indicator is in the oversold area. This will limit the pair's downward potential and trigger a reversal upward. Growth toward the opposite levels of 155.39 and 155.83 can then be expected.
Sell Signal
Scenario No. 1: Today, I plan to sell USD/JPY after the price breaks below 155.13 (red line on the chart), which will lead to a rapid decline in the pair. The key target for sellers will be 154.66, where I will exit sell positions and immediately open buy trades in the opposite direction (expecting a 20–25 point rebound). Pressure on the pair is unlikely to return today.Important! Before selling, make sure the MACD indicator is below the zero line and just beginning to decline from it.
Scenario No. 2: I also plan to sell USD/JPY today in the event of two consecutive tests of the 155.39 level while the MACD indicator is in the overbought zone. This will limit the pair's upward potential and trigger a reversal downward. A decline toward 155.13 and 154.66 can then be expected.
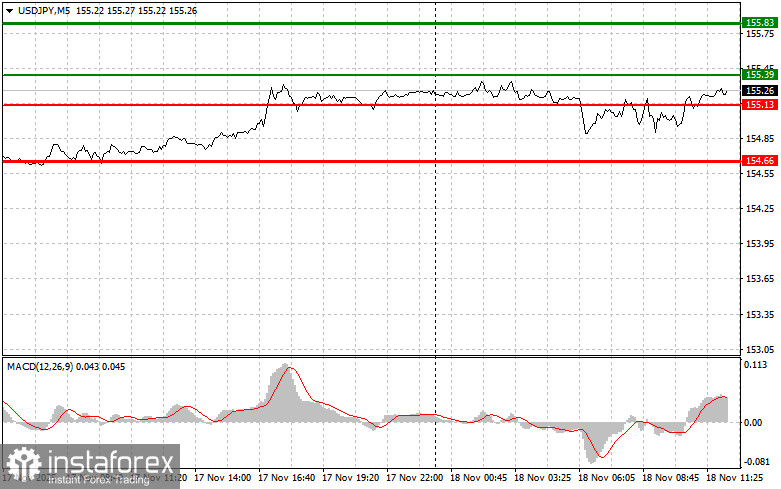
Chart Legend:
- Thin green line – entry price at which the instrument can be bought
- Thick green line – suggested Take Profit level or manual profit-fixing level, as further growth above this point is unlikely
- Thin red line – entry price at which the instrument can be sold
- Thick red line – suggested Take Profit level or manual profit-fixing level, as further decline below this point is unlikely
- MACD indicator – when entering the market, it is important to use overbought and oversold zones as guidance
Important
Beginner Forex traders must make trading decisions very cautiously. Before major fundamental data releases, it is best to remain out of the market to avoid sharp price swings. If you decide to trade during news releases, always place stop-loss orders to minimize losses. Without stop-losses, you can very quickly lose your entire deposit—especially if you ignore money management and trade large volumes.
And remember: successful trading requires a clear trading plan, like the one presented above. Spontaneous trading decisions based solely on current market conditions are an inherently losing strategy for an intraday trader.