 English
  Русский
 Bahasa Indonesia
 Bahasa Malay
 ไทย
ไทย Español
 Deutsch
 Български
 Français
 Tiếng Việt
 中文
中文 বাংলা
বাংলা हिन्दी
 Čeština
 Українська
 Română

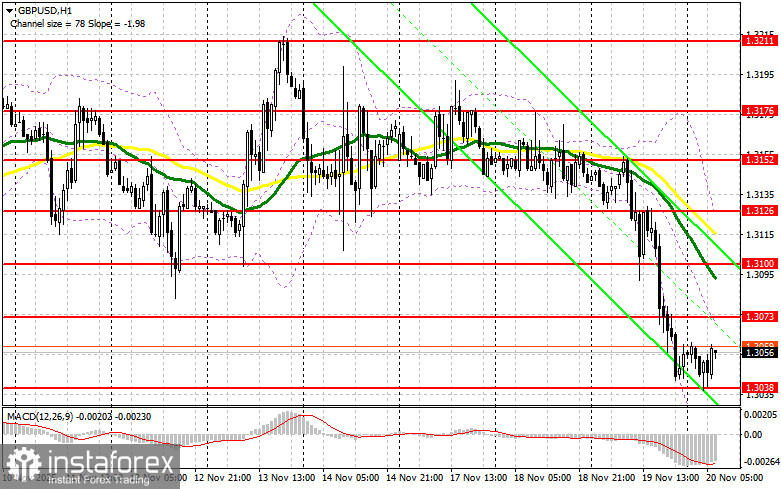
Several suitable entry points into the market were formed yesterday. Let's take a look at the 5-minute chart and analyze what happened. In my morning forecast, I focused on the 1.3138 level and planned to base my trading decisions on it. A decline and the formation of a false breakout around 1.3138 provided an entry point to buy the pound, but after a rise of only 10 pips, demand quickly waned. In the second half of the day, a false breakout in the area of 1.3111 led to short positions, resulting in the pound falling by more than 60 pips.

Long Positions for GBP/USD
The pound has lost all its positions, dropping below the lower boundary of the sideways channel it occupied all week. The decline occurred after it became clear that many Federal Reserve officials consider it appropriate to keep interest rates unchanged until the end of 2025. Today, only data regarding the CBI Industrial Order Balance is expected from the UK. However, even good data is unlikely to help the pound rise, so exercise caution when buying. If the pair continues to decline, only a false breakout around support at 1.3038, formed during morning trading, will provide an opportunity to open long positions targeting a recovery to resistance at 1.3073. A breakout and reverse test of this range would confirm the right actions for buying pounds, potentially leading to a move toward 1.3100. The furthest target will be last week's high at 1.3126, where I will take profits. If GBP/USD declines and there is no buying activity around 1.3038, pressure on the pair will increase, likely driving it toward the next support level at 1.3013. Only a false breakout there will provide a suitable condition for buying the pound. Long positions may also be opened on a rebound from the low of 1.2974, targeting an intraday upward correction of 30-35 pips.
Short Positions for GBP/USD
Sellers made their presence felt yesterday, leading to the formation of a new bearish trend. However, to confirm it, bears must show themselves today around the nearest resistance at 1.3073. A false breakout there will be sufficient to justify selling the pound, targeting a move to support at 1.3038. A breakout and consolidation below this range, along with a reverse test from bottom to top, will provide another suitable option for opening short positions toward 1.3013, reinforcing the bearish trend. The farthest target will be the 1.2974 area, where I will take profits. If GBP/USD rises and there is no active bear action around 1.3073, buyers will get a chance for a larger upward move, potentially leading to a surge toward 1.3100, where the moving averages favor sellers. I plan to open short positions there only after a failed consolidation. If there is no downward movement there, I will sell GBP/USD immediately on a rebound from 1.3132, targeting a 30-35-pip downward correction.
Recommended for Review:
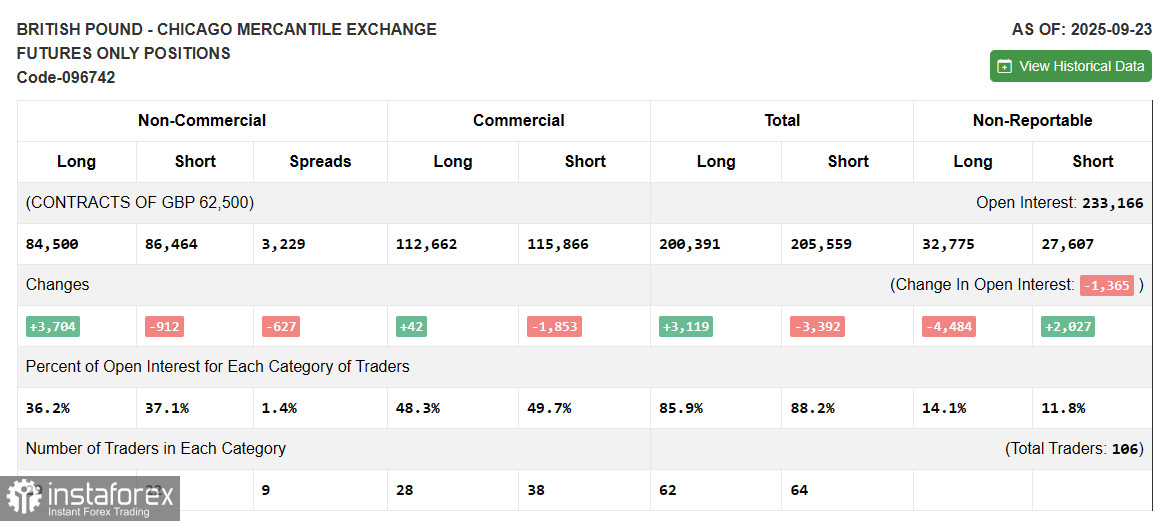
Due to the U.S. government shutdown, fresh Commitment of Traders (COT) data is not being published; the last available report dates back to September 23.
In the COT report for September 23, short positions decreased and long positions increased. Pressure on the dollar continues—especially following the latest data, which is likely to compel the Federal Reserve to maintain its path of interest rate cuts. Meanwhile, the Bank of England's policy remains cautious, indicating its clear plans to continue fighting inflation, although this has not provided much confidence to pound buyers lately.
The short-term future dynamics of the GBP/USD exchange rate will be influenced by new fundamental data. The last COT report indicates that non-commercial long positions increased by 3,704 to 84,500, while non-commercial short positions decreased by 912 to 86,464. As a result, the spread between long and short positions decreased by 627.
Indicator Signals:
Moving Averages: Trading is currently below the 30 and 50-day moving averages, indicating a decline in the pound.
Note: The periods and prices of the moving averages are considered by the author on the hourly chart (H1) and differ from the general definition of classical daily moving averages on the daily chart (D1).
Bollinger Bands: In the event of a decline, support will come from the indicator's lower boundary around 1.3015.
Description of Indicators:
- Moving Average (MA): Determines the current trend by smoothing out volatility and noise. Period – 50. Highlighted in yellow on the chart.
- Moving Average (MA): Determines the current trend by smoothing out volatility and noise. Period – 30. Highlighted in green on the chart.
- MACD Indicator (Moving Average Convergence/Divergence): Fast EMA – period 12. Slow EMA – period 26. SMA – period 9.
- Bollinger Bands: Period – 20.
- Non-commercial Traders: Speculators such as individual traders, hedge funds, and large institutions that use the futures market for speculative purposes, meeting certain requirements.
- Long Non-commercial Positions: The total long open position of non-commercial traders.
- Short Non-commercial Positions: The total short open position of non-commercial traders.
- Total Non-commercial Net Position: The difference between the short and long positions of non-commercial traders.