 English
  Русский
 Bahasa Indonesia
 Bahasa Malay
 ไทย
ไทย Español
 Deutsch
 Български
 Français
 Tiếng Việt
 中文
中文 বাংলা
বাংলা हिन्दी
 Čeština
 Українська
 Română

GBP/USD 5M Analysis
Unlike the EUR/USD pair, the GBP/USD currency pair is maintaining an upward trend. On Tuesday, the British pound traded lower, but there were no fundamental reasons for its decline. The euro could have reacted with a drop to the German inflation report, as a slowdown in inflation below 2% implies a possible resumption of monetary policy easing by the ECB. The British pound, however, had no such reports. Therefore, the only conclusion we can draw is that the euro pulled the pound down with it.
From a technical standpoint, the British pound does not have a trend line, but it does have two Ichimoku indicator lines acting as support for the current trend. As early as today, the Kijun-sen line may be tested. If the price holds above it, the pair's growth will resume. However, we would like to remind you that today the United States will release an important package of macroeconomic statistics, and on Friday a super-important package of macroeconomic data will be published. Thus, by the end of the week, we may see both strong growth and strong decline. Of course, we assume that the labor market will once again show poor results, but we cannot be certain of that. Moreover, it is not the results themselves that matter, but the ratio of the actual value to the forecast.
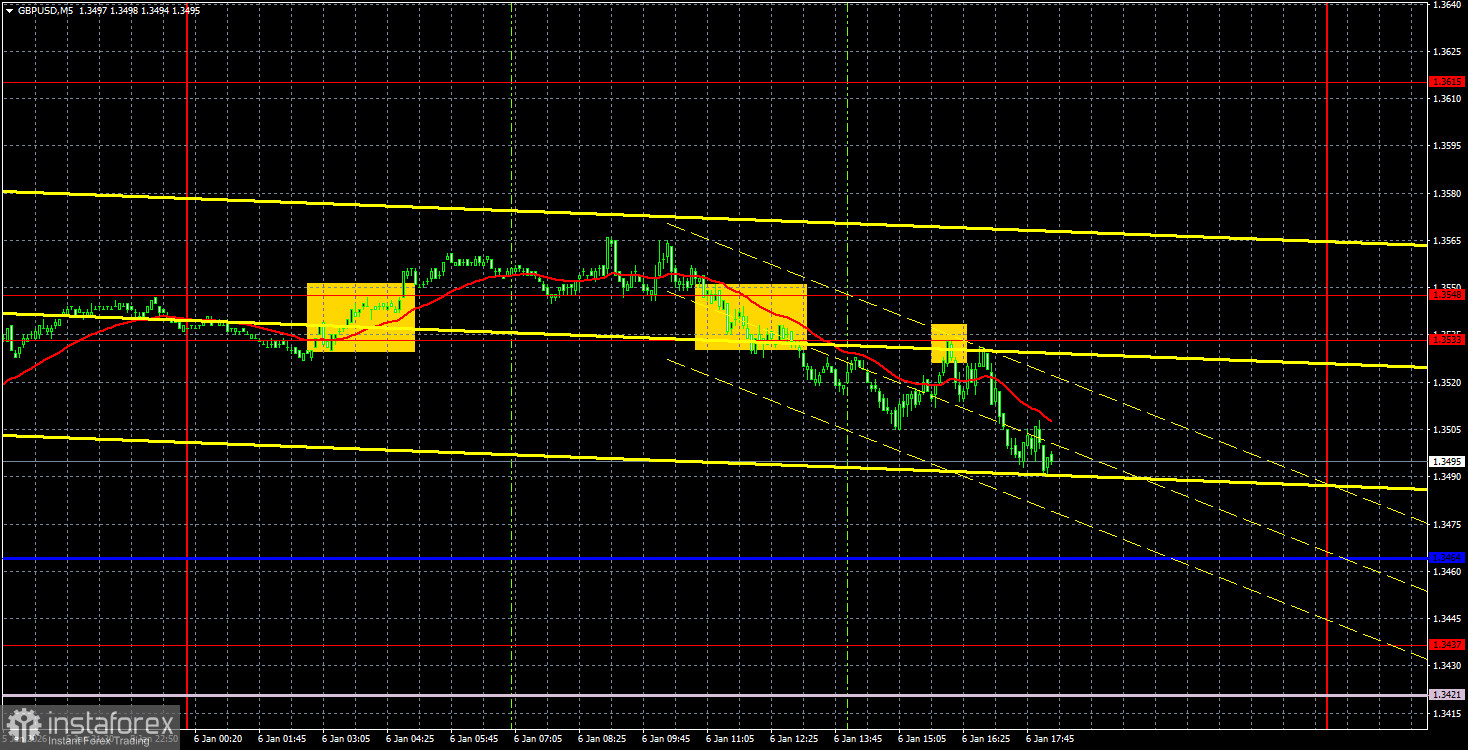
On the 5-minute timeframe, three trading signals were formed on Tuesday. During the Asian trading session, the pair consolidated above the 1.3533–1.3548 level, but this signal turned out to be false, and the price failed to continue rising. During the European session, the pair consolidated below this area, and during the U.S. session, it rebounded from below. Thus, two more sell signals were generated, duplicating each other, and they could be traded with a target at the critical line.
COT Report
COT reports on the British pound show that in recent years, the sentiment of commercial traders has been constantly changing. The red and blue lines representing the net positions of commercial and non-commercial traders constantly intersect and, in most cases, remain close to the zero level. At present, the lines are moving away from each other, but non-commercial traders are currently dominating with sell positions. Speculators are increasingly selling the pound, but as we have already said, it does not matter how low demand for the British currency is—demand for the U.S. dollar is often even lower.
The dollar continues to decline due to Donald Trump's policies, which is clearly visible on the weekly timeframe (illustration above). The trade war will continue in one form or another for a long time, and the Fed will in any case cut rates over the next 12 months. Demand for the dollar will decline one way or another. According to the latest COT report (dated December 23) on the British pound, the "Non-commercial" group opened 1.6 thousand buy positions and closed 5.7 thousand sell positions. Thus, the net position of non-commercial traders increased by 7.3 thousand over the week.
In 2025, the pound has risen quite strongly, but it should be understood that there is only one reason—Donald Trump's policies. As soon as this factor is neutralized, the dollar may start rising, but no one knows when that will happen.
GBP/USD 1H Analysis
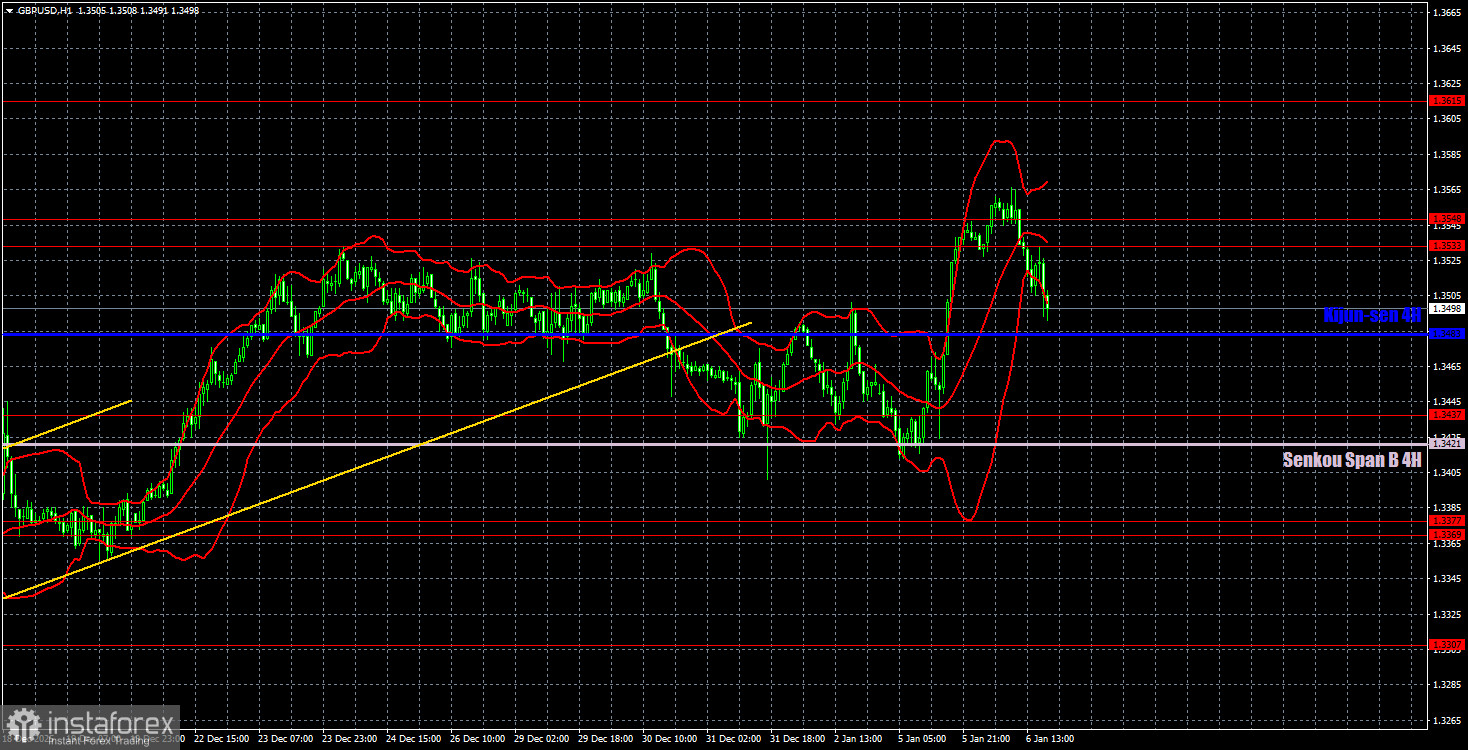
On the hourly timeframe, the GBP/USD pair continues to form an upward trend despite breaking through the trend line. We believe that the growth of the pound in the medium term will continue regardless of the local macroeconomic and fundamental background. The trend for the pound remains bullish on almost all timeframes. The Senkou Span B line did not allow the price to move below it, signaling a resumption of the local upward trend.
For January 7, we highlight the following key levels: 1.3042–1.3050, 1.3096–1.3115, 1.3201–1.3212, 1.3307, 1.3369–1.3377, 1.3437, 1.3533–1.3548, 1.3615, 1.3681, 1.3763. The Senkou Span B (1.3421) and Kijun-sen (1.3483) lines may also serve as signal sources. It is recommended to move the Stop Loss to breakeven once the price moves 20 points in the correct direction. The Ichimoku indicator lines may shift during the day, which should be taken into account when identifying trading signals.
On Wednesday, no important publications or events are scheduled in the United Kingdom, while three reports of medium importance will be released in the United States. These include the ADP report, which shows changes in private-sector employment; the JOLTs report on the number of job openings; and the ISM Services PMI for the U.S.
Trading Recommendations:
Today, traders may consider sell positions if the price consolidates below the critical line, targeting the 1.3421–1.3437 level. Long positions will be relevant if the price rebounds from the Kijun-sen line or from the 1.3421–1.3437 level.
Explanations to the Illustrations:
- Support and resistance price levels – thick red lines near which price movement may end. They are not sources of trading signals.
- Kijun-sen and Senkou Span B lines – Ichimoku indicator lines transferred to the hourly timeframe from the 4-hour timeframe. They are strong levels.
- Extreme levels – thin red lines from which the price previously rebounded. They are sources of trading signals.
- Yellow lines – trend lines, trend channels, and any other technical patterns.
- Indicator 1 on the COT charts – the size of the net position of each trader category.