 English
  Русский
 Bahasa Indonesia
 Bahasa Malay
 ไทย
ไทย Español
 Deutsch
 Български
 Français
 Tiếng Việt
 中文
中文 বাংলা
বাংলা हिन्दी
 Čeština
 Українська
 Română

Analysis GBP/USD 5M
The GBP/USD currency pair, is different from the EUR/USD pair. Hard to believe, but there is no ascending trendline on the hourly timeframe; the decline has lasted only 4 days, and traders have failed to confidently overcome the last 2 lows. True, the price settled below the Senkou Span B and Kijun-sen lines; however, recall that the foundations for U.S. currency growth in January are highly doubtful. On Friday, it became known that the U.S. labor market continues to deteriorate. The 60,000 new jobs created in December are a drop in the ocean, especially considering that the values for the previous two months were revised down by almost 80,000. Thus, jobs in the U.S. are being created "with difficulty," and their number is insufficient to stop the unemployment rate from rising. Based on this, we do not consider the official unemployment decline to 4.4% in December something to celebrate.
The Federal Reserve is unlikely to cut the key rate in January, but the market still has to digest the December consumer price index this week. If inflation continues to fall, the market will begin to expect more dovish Fed actions in 2026—and to sell the dollar.
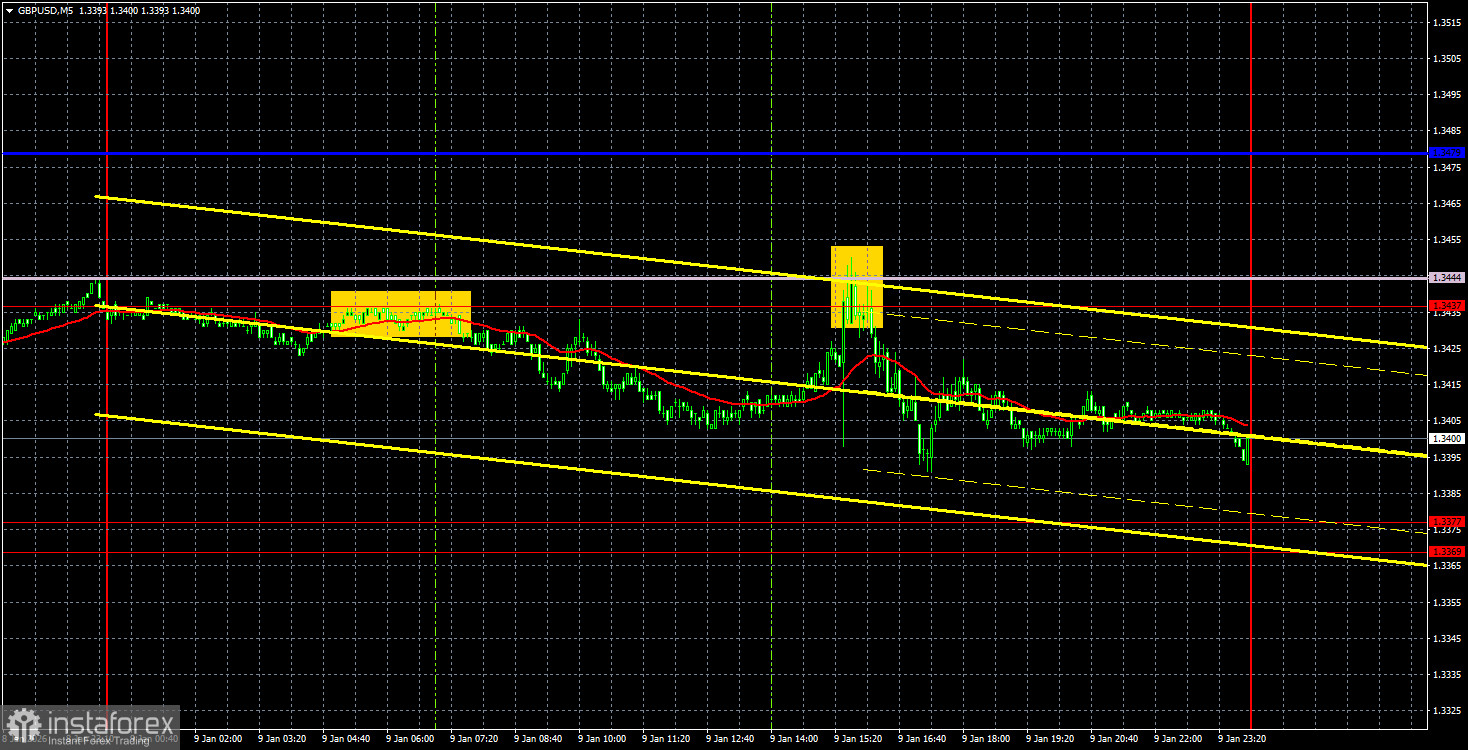
On the 5-minute TF on Friday, two trading signals were formed. Both were sell signals. The price bounced twice from the 1.3437–1.3444 area (Senkou Span B line). In the first case, the pound fell about 20 pips; in the second, 35. The 1.3369–1.3377 area, which is located very close, was still not reached.
COT Report
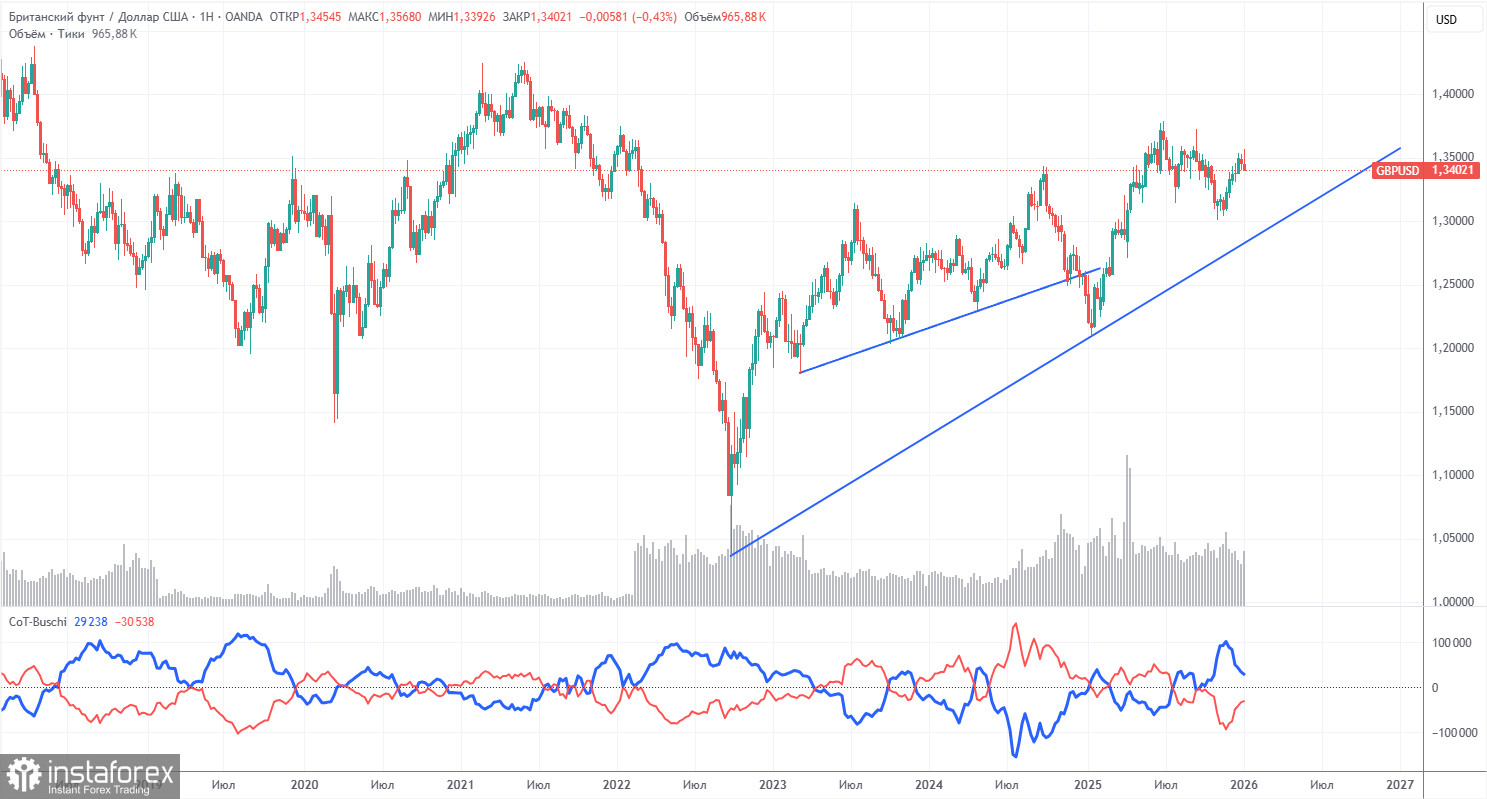
COT reports for the British pound show that, in recent years, commercial traders' sentiment has fluctuated. The red and blue lines, reflecting the net positions of commercial and non-commercial traders, constantly cross and, in most cases, are near zero. Currently, the lines are moving apart, but non-commercial traders dominate with... short positions. Speculators increasingly sell the pound, but, as we already said, it does not matter how low the demand for the pound is. Demand for the U.S. dollar is often even lower.
The dollar continues to decline due to Donald Trump's policy, as shown clearly on the weekly TF (illustration above). The trade war will continue in one form or another for a long time, and the Fed will, in any case, lower the rate within the next 12 months. Demand for the dollar will decline one way or another. According to the latest COT report (dated January 6) for the British pound, the "Non-commercial" group opened 700 BUY contracts and 4,300 SELL contracts. Thus, the net position of non-commercial traders increased by 2,700 contracts during the week.
In 2025, the pound rose quite strongly, but it should be understood that the reason is one: Donald Trump's policy. As soon as this reason is neutralized, the dollar may resume growth, but no one knows when.
Analysis GBP/USD 1H
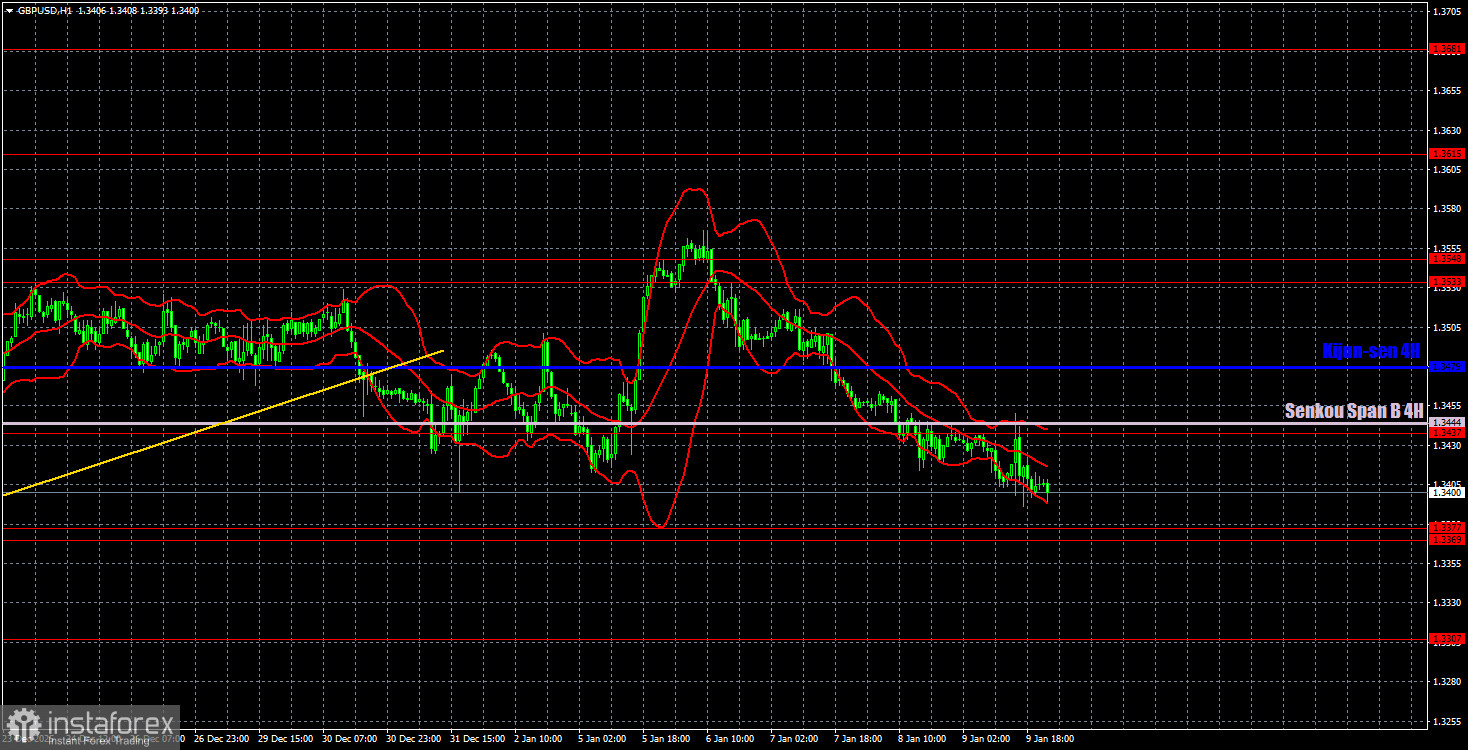
On the hourly timeframe, GBP/USD continues to form an upward trend, despite the breach of the trendline. We believe the pound's medium-term rise will continue regardless of the local macroeconomic and fundamental backdrop. At present, the euro, which has been declining for three weeks, can pull the pound down.
For January 12, we highlight the following important levels: 1.3042–1.3050, 1.3096–1.3115, 1.3201–1.3212, 1.3307, 1.3369–1.3377, 1.3437, 1.3533–1.3548, 1.3615, 1.3681, 1.3763. The Senkou Span B (1.3444) and Kijun-sen (1.3479) lines can also be sources of signals. It is recommended to move the stop loss to breakeven after the price moves 20 pips in the correct direction. Ichimoku indicator lines may shift during the day, which should be taken into account when determining trading signals.
On Monday, there are again no important reports or events scheduled in the UK, and in the U.S., industrial production will be released, which, under current circumstances, is unlikely to be considered important. Most likely, we will witness another "boring Monday," but recently "boring Mondays" have been observed on Tuesdays, Wednesdays, Thursdays, and Fridays as well.
Trading Recommendations:
Today, traders may consider selling if the price consolidates below the 1.3369–1.3377 area with a target of 1.3307. Long positions will become relevant if the price bounces off the 1.3369–1.3377 area with a target of the 1.3437–1.3444 area.
Explanations of the illustrations:
- Price support and resistance levels (resistance/support) — thick red lines near which movement may end. They are not sources of trading signals.
- Kijun-sen and Senkou Span B lines — Ichimoku indicator lines transferred to the hourly timeframe from the 4-hour. They are strong lines.
- Extremum levels — thin red lines from which the price previously bounced. They are sources of trading signals.
- Yellow lines — trend lines, trend channels, and any other technical patterns.
- Indicator 1 on the COT charts — the size of the net position of each trader category.