 English
  Русский
 Bahasa Indonesia
 Bahasa Malay
 ไทย
ไทย Español
 Deutsch
 Български
 Français
 Tiếng Việt
 中文
中文 বাংলা
বাংলা हिन्दी
 Čeština
 Українська
 Română

On Tuesday, GBP/USD extends the corrective recovery that began from the 1.3390 level, where the 200-day simple moving average (SMA) is located. The primary source of support for the pound is weakening interest in the US dollar, which has come under pressure due to growing doubts about the Federal Reserve's independence. Pressure on the US currency intensified following reports of a criminal investigation being launched against Fed Chair Jerome Powell. In a rare public statement, Powell stressed that threats of criminal prosecution are linked to the Fed's interest-rate decisions being guided by public interest rather than the president's political preferences.
Despite these negative developments, the US dollar has managed to halt its decline as expectations for more aggressive monetary easing by the Federal Reserve have diminished. This, in turn, is limiting further upside in GBP/USD.
A decline in the US unemployment rate overshadowed weaker-than-expected Nonfarm Payrolls (NFP) data, reinforcing expectations that monetary policy will remain on hold in the first quarter. This is preventing dollar bears from engaging in aggressive selling, as investor attention is now focused on today's upcoming US inflation (CPI) data.
Additional pressure on the pound comes from rising expectations of two more interest rate cuts by the Bank of England in 2026, which could cap the pair's upward potential. In the coming days, GBP/USD dynamics will also depend on the release of the US Producer Price Index (PPI) on Wednesday and the UK GDP report on Thursday, both of which could set the pair's short-term direction.
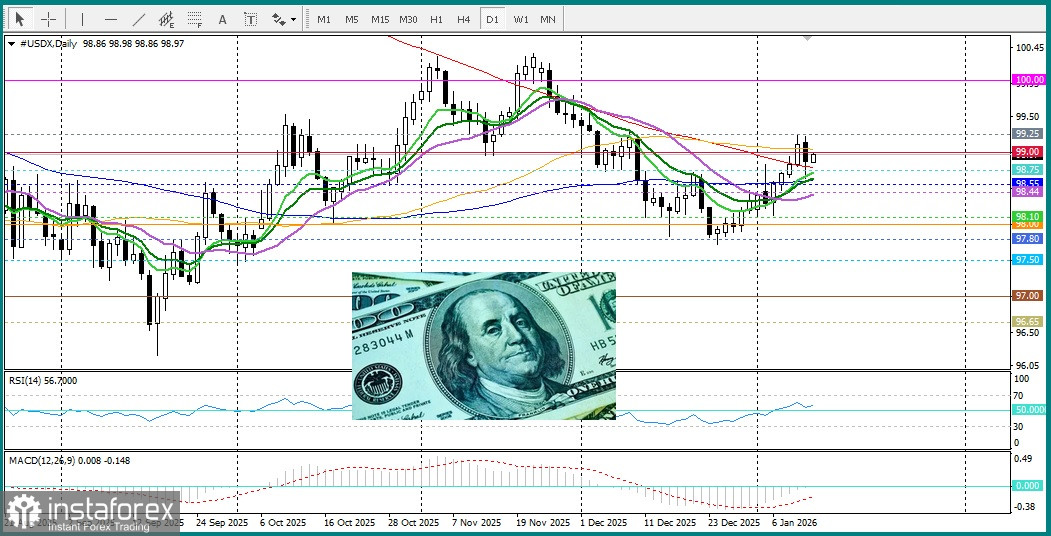
From a technical perspective, daily-chart oscillators remain in positive territory, confirming a constructive outlook. The pair is supported by a confluence of three moving averages and is currently trading near resistance at 1.3470, above which the next resistance is seen at the psychological 1.3500 level.
However, a drop below the 200-day SMA would signal a loss of bullish control.