 English
  Русский
 Bahasa Indonesia
 Bahasa Malay
 ไทย
ไทย Español
 Deutsch
 Български
 Français
 Tiếng Việt
 中文
中文 বাংলা
বাংলা हिन्दी
 Čeština
 Українська
 Română

Analysis of Friday's Trades:
1H Chart of EUR/USD
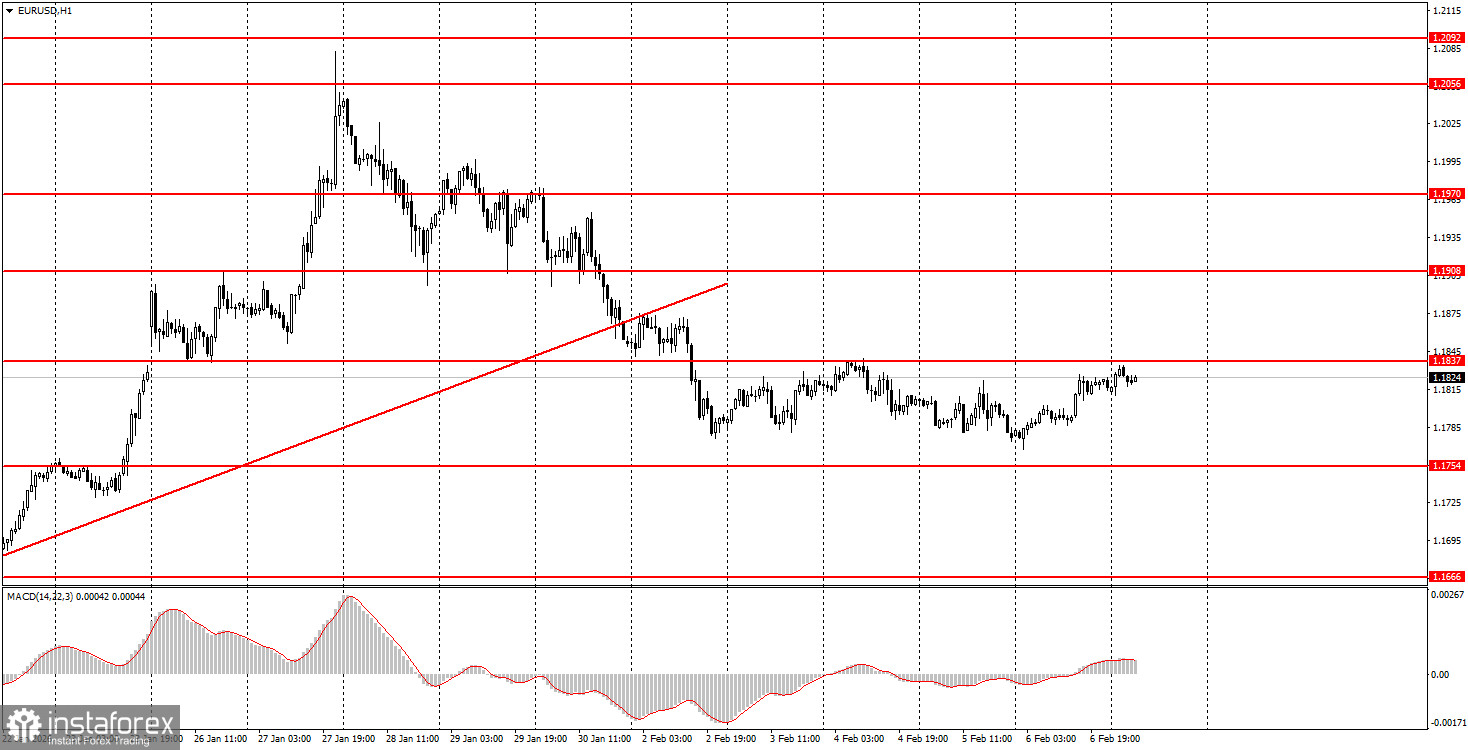
The EUR/USD currency pair was in an upward movement for most of Friday. It cannot be said that this movement was driven by macroeconomic background or fundamental events. Throughout the day, traders could focus on only two events: Germany's industrial production and the U.S. consumer sentiment index. Let's take a look at these two indicators. As has become customary, Germany's industrial production did not show a strong result. With forecasts around -0.3%, the actual figure was -1.9%. Thus, this report could not have triggered growth for the European currency. The University of Michigan's consumer sentiment index came in better than expected, which should have led to a decline in the pair, meaning a rise for the dollar. However, this did not happen either. Therefore, the macroeconomic background did not influence the pair's movement throughout the day. The price has been trading between 1.1754 and 1.1837 for four consecutive days, so it is fair to say we are in a flat. Currently, the price is near the upper boundary of that range.
5M Chart of EUR/USD
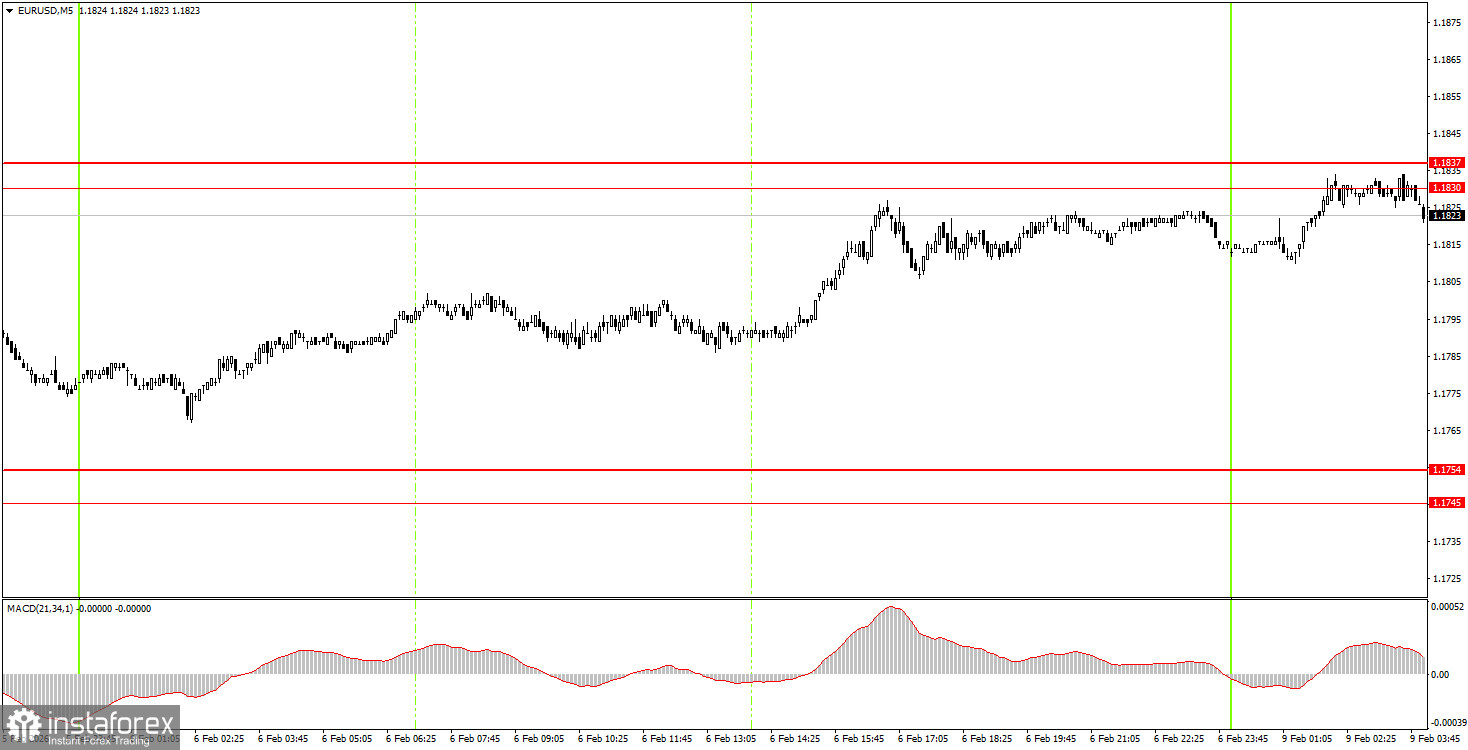
On the 5-minute timeframe, no trading signals were formed on Friday. Volatility throughout the day was very weak, and the price only traded in the 1.1830-1.1837 range last night, allowing positions to be opened. Thus, there were no grounds for beginner traders to take any trades on Friday.
How to Trade on Monday:
The hourly timeframe shows that a downward correction is ongoing, which can be regarded as a local trend. Recall that the flat period lasting for 7 months has concluded. If that's the case, then the long-term upward trend has resumed at the beginning of 2026. Therefore, we expect a new medium-term decline in the dollar. The overall fundamental backdrop remains very challenging for the American currency, so we fully support further movement to the north.
On Monday, beginner traders may consider opening new short positions if the market bounces from the 1.1830-1.1837 area, targeting 1.1745-1.1754. A consolidation above the 1.1830-1.1837 area will allow opening long positions with a target at 1.1908.
On the 5-minute timeframe, the following levels should be considered: 1.1354-1.1363, 1.1413, 1.1455-1.1474, 1.1527-1.1531, 1.1550, 1.1584-1.1591, 1.1655-1.1666, 1.1745-1.1754, 1.1830-1.1837, 1.1908, 1.1970-1.1988, 1.2044-1.2056, 1.2092-1.2104.
Today, Christine Lagarde will give a speech in the Eurozone; she last spoke last Thursday after the European Central Bank meeting. We do not expect any important announcements from her. In the U.S., the events calendar is empty today. Therefore, we may be looking at a boring Monday.
Main Rules of the Trading System:
- The strength of the signal is determined by the time it takes to form (rebound or breaking through the level). The shorter the time, the stronger the signal.
- If two or more trades were opened around a particular level based on false signals, all subsequent signals from that level should be ignored.
- In a flat market, any pair can generate numerous false signals or no signals at all. In any case, it is best to stop trading at the first signs of a flat.
- Trades are opened during the time period between the start of the European session and until the middle of the American session, after which all trades should be manually closed.
- On the hourly timeframe, signals from the MACD indicator should ideally be traded only when there is good volatility and a trend confirmed by a trend line or channel.
- If two levels are too close to each other (ranging from 5 to 20 pips), they should be considered as a support or resistance area.
- After moving 15 pips in the correct direction, it is advisable to set the Stop Loss to break-even.
What's on the Charts:
- Support and resistance levels are targets for opening buy or sell trades. Take Profit levels can be placed around them.
- Red lines indicate channels or trend lines that reflect the current trend and indicate the preferred direction for trading now.
- The MACD indicator (14,22,3) – the histogram and signal line – serves as a supplementary indicator that can also be used as a source of signals.
- Important speeches and reports (always found in the news calendar) can significantly influence the movement of the currency pair. Therefore, during their release, trading should be conducted with maximum caution, or it is advised to exit the market to avoid a sharp price reversal against the preceding movement.
- Beginners trading in the Forex market should remember that not every trade can be profitable. Developing a clear strategy and practicing sound money management are the keys to long-term trading success.