 English
  Русский
 Bahasa Indonesia
 Bahasa Malay
 ไทย
ไทย Español
 Deutsch
 Български
 Français
 Tiếng Việt
 中文
中文 বাংলা
বাংলা हिन्दी
 Čeština
 Українська
 Română

Analysis of EUR/USD 5M
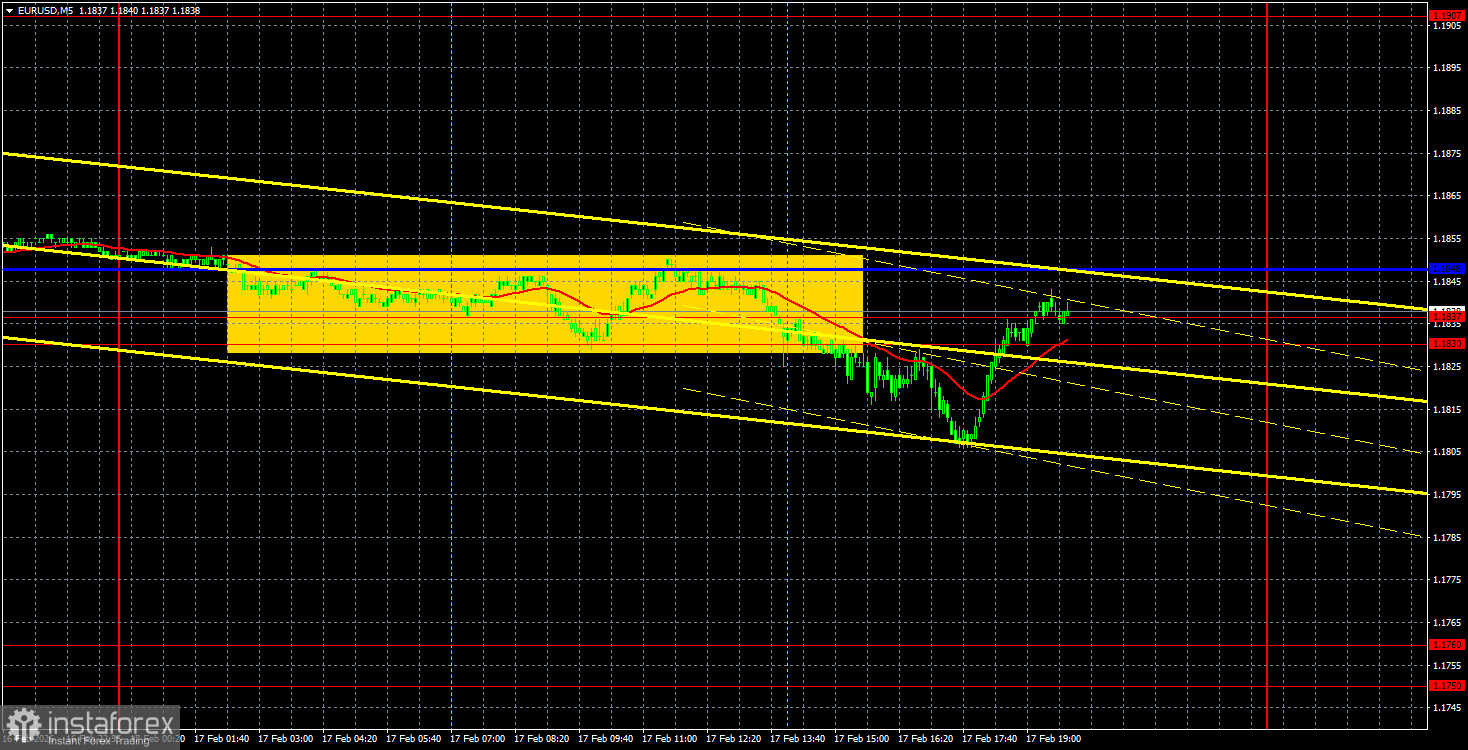
The EUR/USD currency pair demonstrated astonishingly low volatility on Tuesday, amounting to approximately 47 pips. Yes, this is more than on Monday or Friday, but it is still very little. For most of the day, the price remained stagnant, particularly throughout the European trading session. We only saw some movements in the late afternoon, which were unlikely to be directly related to the ZEW economic activity indices or the weekly ADP report.
In general, there were no significant events or reports on Tuesday. The euro currency continues to drift downwards, which certainly does it no credit. The most interesting thing is that it is currently extremely difficult to explain why the euro has been depreciating for more than a week and why market volatility has once again dropped to minimal values. It seems that the market is indifferent to the direction of trading, so a downward movement it shall be. Even based on U.S. reports from last week, we see no reason for the American currency to appreciate. Even if "dovish" market sentiment hasn't intensified after the labor market and inflation reports, it doesn't justify a rise in the U.S. dollar.
On the 5-minute timeframe yesterday, one trading signal was formed. The pair gathered strength for over 10 hours and finally broke through the 1.1830-1.1848 area. However, the decline proved brief—during the American trading session, the dollar came under pressure, and the price quickly returned to the area of 1.1830-1.1848.
COT Report
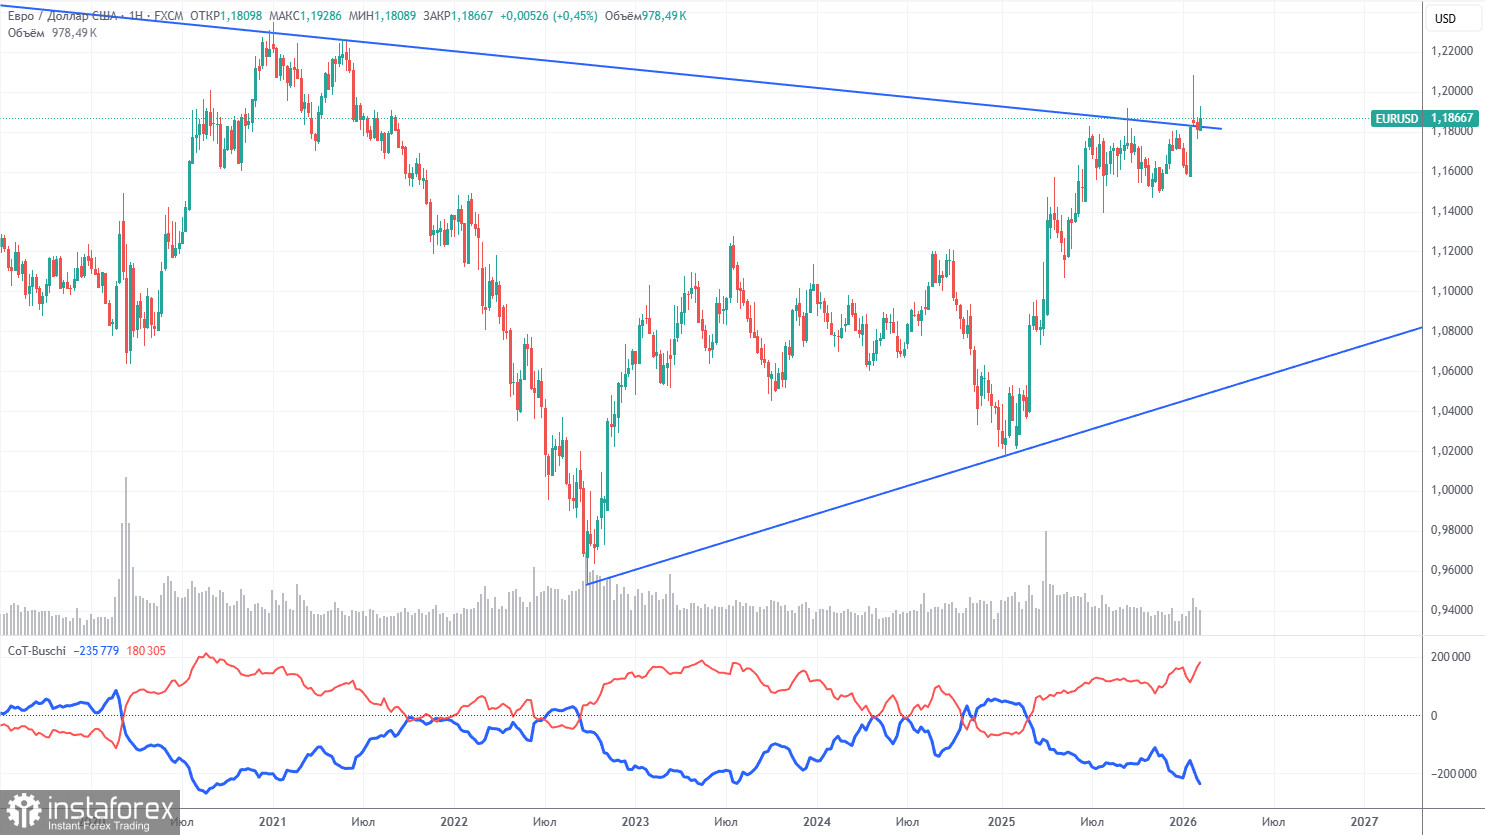
The latest COT report is dated February 10. The illustration on the weekly timeframe clearly shows that the net position of non-commercial traders remains "bullish." Since Trump took office as President of the United States for the second time, only the dollar has been falling. We can't say with 100% certainty that the decline of the American currency will continue, but current global developments hint at this possibility.
We still do not see any fundamental factors that would strengthen the euro, whereas there are enough factors for the decline of the American dollar. The global downward trend remains in place, but what does it matter where the price has moved over the last 18 years? Over the last three years, a new upward trend is forming, having broken the global descending trend line. Thus, the path further upward is open.
The positioning of the red and blue lines of the indicator continues to indicate the preservation of the "bullish" trend. Over the last reporting week, the number of longs in the "Non-commercial" group increased by 16,400, while the number of shorts decreased by 500. Accordingly, the net position increased by another 16,900 contracts over the week.
Analysis of EUR/USD 1H
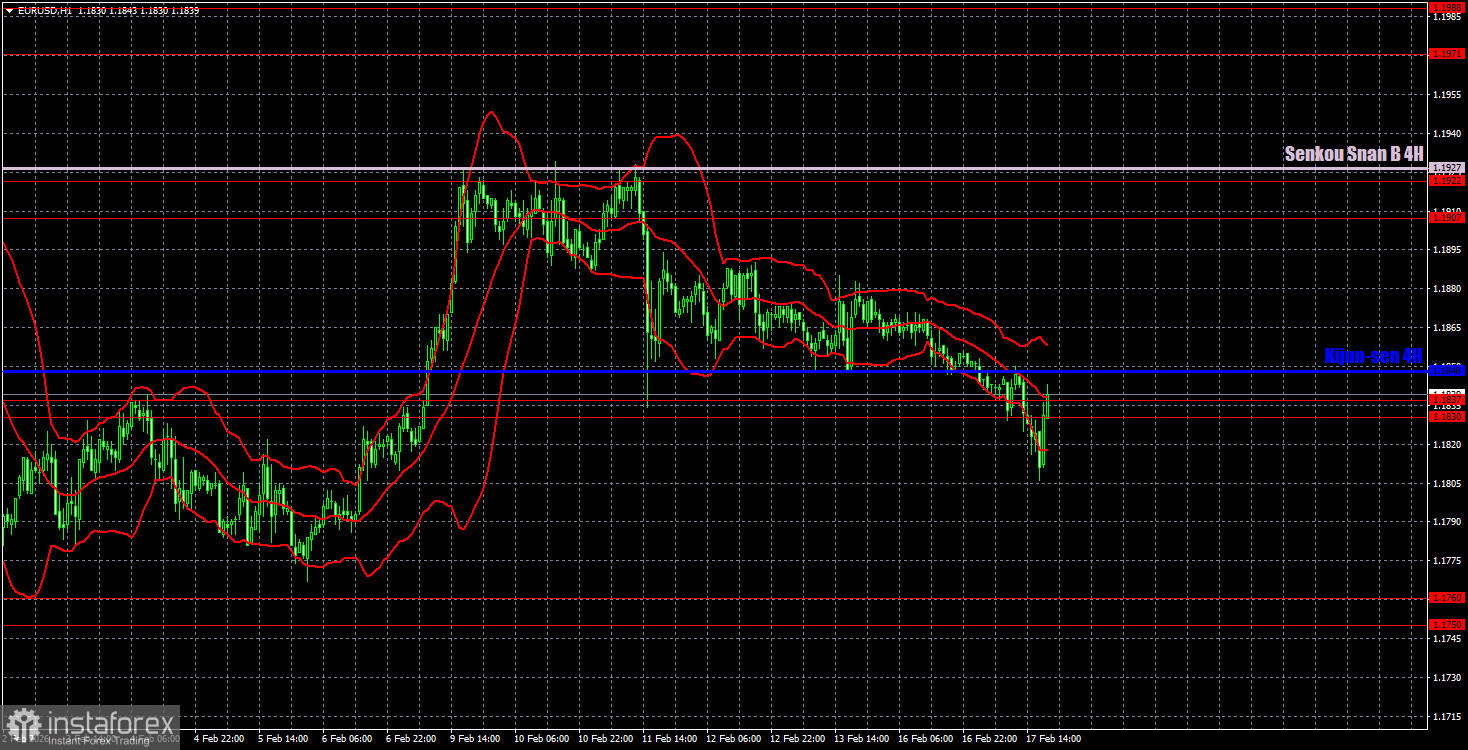
On the hourly timeframe, the EUR/USD pair remains below the Senkou Span B line, hindering its upward movement. The pair exited the sideways channel of 1.1400-1.1830 at the beginning of the year, in which it spent seven months, so the upward trend has officially resumed. For a technical recovery of the upward trend on the hourly timeframe, the price now needs to consolidate above the Senkou Span B line. In the near future, trades could take place between 1.1830 and 1.1927.
For February 18, we highlight the following trading levels: 1.1362, 1.1426, 1.1542, 1.1604-1.1615, 1.1657-1.1666, 1.1750-1.1760, 1.1830-1.1837, 1.1907-1.1922, 1.1971-1.1988, 1.2051, and 1.2095, as well as the Senkou Span B line (1.1927) and Kijun-sen line (1.1848). The Ichimoku indicator lines may move throughout the day, which should be taken into account when determining trading signals. Do not forget to set a Stop Loss order to break even if the price has moved 15 pips in the right direction. This will protect against potential losses if the signal turns out to be false.
On Wednesday, there are no important or at least interesting events scheduled in the Eurozone, while in the U.S., reports on building permits, housing starts, and durable goods orders will be published. Collectively, these reports could influence the U.S. dollar's exchange rate.
Trading Recommendations:
On Wednesday, traders may trade again in the 1.1830-1.1848 range. New longs will become relevant if the price consolidates above this area with a target of 1.1907-1.1927. Short positions can be considered with a new bounce from the area of 1.1830-1.1848, targeting 1.1750-1.1760.
Explanations for Illustrations:
Support and resistance levels – thick red lines around which movement may end. They are not sources of trading signals.
Kijun-sen and Senkou Span B lines – lines from the Ichimoku indicator transferred to the hourly timeframe from the 4-hour timeframe. They are strong lines.
Extreme levels – thin red lines from which the price has previously bounced. They are sources of trading signals.
Yellow lines – trend lines, trend channels, and any other technical patterns.
Indicator 1 on COT charts – the size of the net position of each category of traders.