 English
  Русский
 Bahasa Indonesia
 Bahasa Malay
 ไทย
ไทย Español
 Deutsch
 Български
 Français
 Tiếng Việt
 中文
中文 বাংলা
বাংলা हिन्दी
 Čeština
 Українська
 Română

The GBP/USD currency pair also showed an illogical decline in quotes on Monday. The day began with a rather predictable rise, but it didn't last long. Now, take a close look at the lower timeframe charts from Friday and Monday. Do you get the impression that, in these days, the market was reflecting the positive reports on UK business activity and retail sales, the disappointing American GDP, and Donald Trump's disregard for the Supreme Court's cancellation of tariffs while introducing new ones? The dollar is rising as if Trump himself had canceled all his trade tariffs, bombed all of Iran, and the Federal Reserve (as a bonus) had started a new cycle of monetary policy tightening. Well, all that is left is to repeat what we've been saying for the past two weeks: market movements are now illogical, so it is best to base trading decisions on technical factors.
For the sake of fairness, it should be noted that the British pound had reasons for its decline in recent weeks. Many reports have come in weaker than expected, particularly inflation, unemployment, and GDP. However, analyzing these reports raises many questions. Why does the market react to weak GDP in the UK, but ignore a disappointing GDP in the U.S.? Why is a decrease in inflation in the UK to 3% a guarantee of new easing of monetary policy, while a decrease in inflation in the U.S. to 2.4% means nothing? The British pound is falling, and the dollar is rising, certainly not based on macroeconomic data.
Perhaps the market is confident in Trump's attack on Iran? What if American military operations do not start in 10-15 days, but in three months? Over all this time, will the dollar continue to rise amid escalating military confrontation in the Middle East? We believe that the only reason for the rise of the American currency at the moment is capital flows. Someone among the very large players is withdrawing dollars from circulation, increasing demand for them, which is why we are observing such movement. Who this "someone" is and what their motivation might be is unknown. This "someone" is clearly not paying any attention to macroeconomic and fundamental factors. Therefore, we do not recommend doing so in the near future. The GBP/USD pair is falling under almost any circumstances.
There may also be simple manipulation at play, which explains a lot. Who expected the American currency to rise on Monday? Practically no one. And yet we saw exactly that rise! What could this be if not a hunt for stop losses and liquidity? Perhaps market makers are manipulating the market to gather as much liquidity as possible before a new prolonged rise in the GBP/USD pair. By the way, signals from the CCI indicator, which are formed rather rarely and are therefore valuable, are also being ignored. Everything that does not favor the American currency is currently being disregarded.
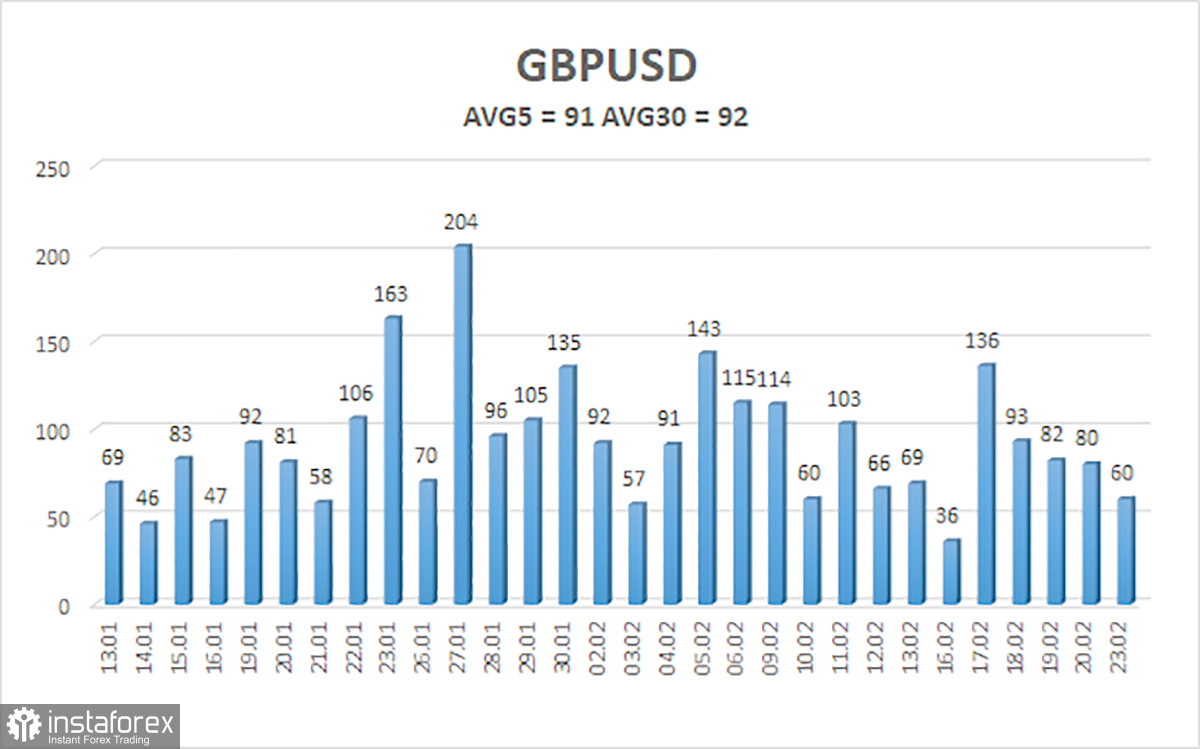
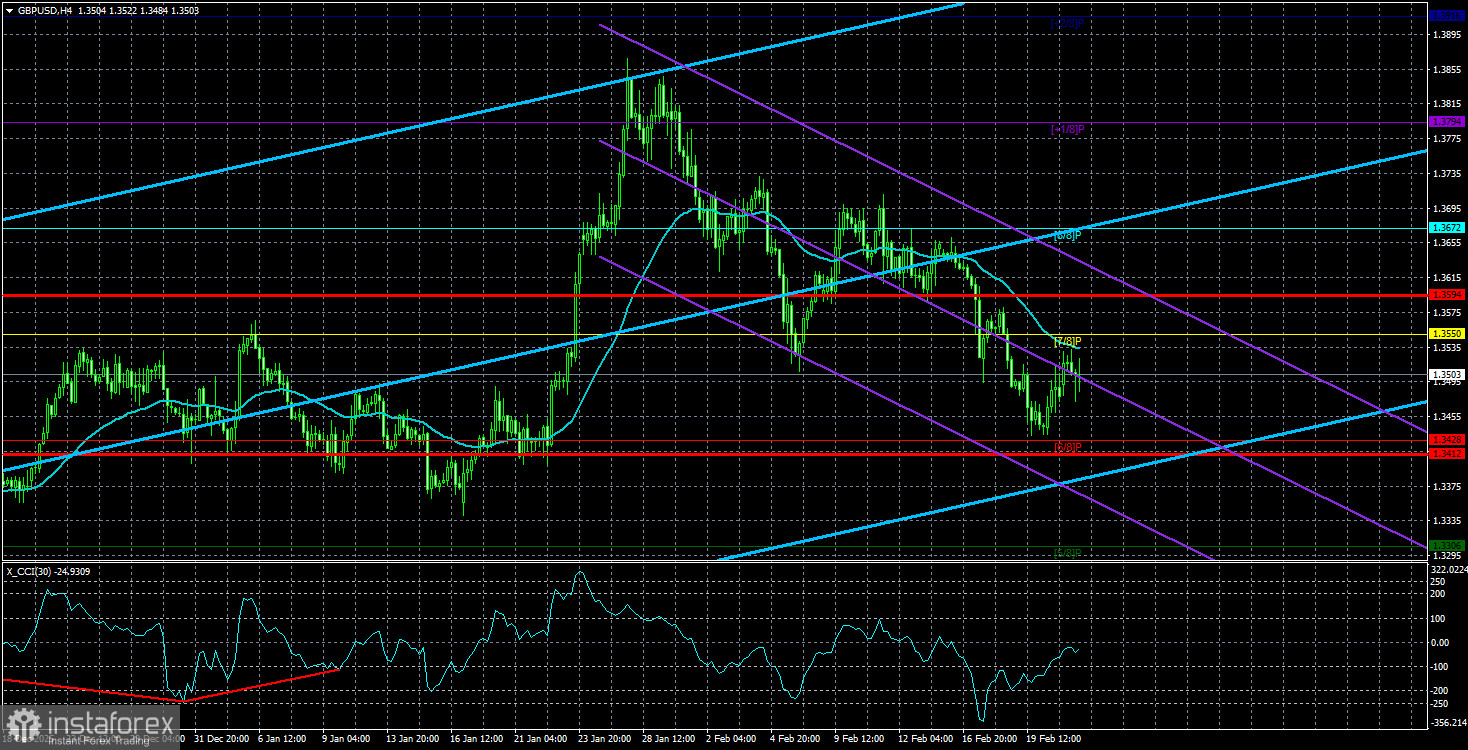
The average volatility of the GBP/USD pair over the past five trading days is 91 pips. For the pound/dollar pair, this value is considered "average." On Tuesday, February 24, we expect movement within a range bounded by levels 1.3412 and 1.3594. The upper channel of the linear regression is directed upwards, indicating a recovery of the trend. The CCI indicator has entered oversold territory, signaling a possible completion of the correction.
Nearest support levels:
S1 – 1.3428
S2 – 1.3306
S3 – 1.3184
Nearest resistance levels:
R1 – 1.3550
R2 – 1.3672
R3 – 1.3794
Trading Recommendations:
The GBP/USD currency pair is set to continue its 2025 upward trend, and its long-term prospects remain unchanged. Donald Trump's policies will continue to exert pressure on the U.S. economy; therefore, we do not expect the American currency to grow in 2026. Even its status as a "reserve currency" no longer holds significance for traders. Thus, long positions with a target of 1.3916 or higher remain relevant in the near term, as the price is above the moving average. If the price is positioned below the moving average line, small shorts may be considered with targets at 1.3428 and 1.3412 on technical (correctional) grounds. From time to time, the American currency shows corrections (in a global sense), but for trend growth, it needs global positive factors.
Explanations for Illustrations:
Linear regression channels help determine the current trend. If both are directed in the same way, the trend is currently strong;
The moving average line (settings 20,0, smoothed) determines the short-term trend and direction in which trading should currently be conducted;
Murray levels are target levels for movements and corrections;
Volatility levels (red lines) indicate the likely price channel in which the pair will trade over the next 24 hours, based on current volatility indicators;
The CCI indicator entering the oversold area (below -250) or the overbought area (above +250) indicates that a trend reversal is approaching in the opposite direction.