 English
  Русский
 Bahasa Indonesia
 Bahasa Malay
 ไทย
ไทย Español
 Deutsch
 Български
 Français
 Tiếng Việt
 中文
中文 বাংলা
বাংলা हिन्दी
 Čeština
 Українська
 Română

During Tuesday, the EUR/USD pair declined to the 100.0% Fibonacci retracement level at 1.1577 and rebounded from it twice. Thus, a reversal in favor of the European currency and some growth toward the 76.4% Fibonacci level at 1.1696 may occur. A consolidation below 1.1577 would work in favor of the US dollar and the continuation of the decline toward the next corrective level of 127.2% – 1.1440.
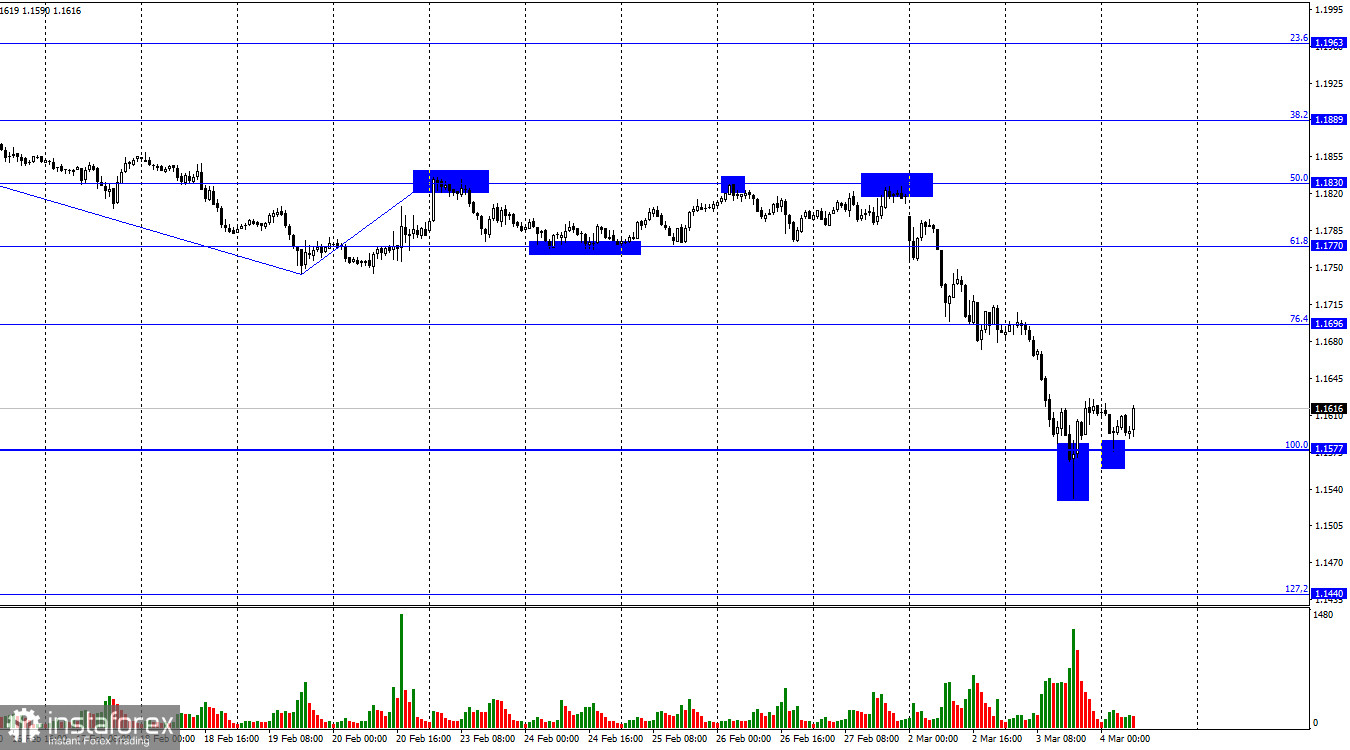
The wave structure on the hourly chart remains straightforward. The last completed upward wave failed to break the peak of the previous wave, while the new downward wave confidently broke the previous low. Thus, the trend remains bearish. The bulls have taken a pause within what had been a large-scale offensive that would have been impossible without Donald Trump, yet it is precisely Donald Trump's actions in the Middle East — which triggered large-scale military operations involving about a dozen countries — that are now working in favor of the US currency.
On Tuesday, the news background once again revolved around a single topic — the war in the Middle East. However, as military operations continue across virtually all Persian Gulf countries, traders have begun shifting their attention from the conflict itself to its consequences. One of the most obvious consequences is a gas and energy crisis across the world. In just Monday and Tuesday, gas prices more than doubled amid the shutdown of gas facilities in Qatar that were struck by Iran. Oil and gas prices are also rising due to the blockade of the Strait of Hormuz, through which roughly a quarter of the world's oil passes daily. Rising oil and gas prices will be incorporated into nearly all goods and services. Logistics costs will increase, air travel will become more expensive, and any transportation expenses — which are embedded in almost all goods — will rise. Higher prices themselves mean inflation. Thus, inflation may accelerate in the near future in virtually all countries worldwide, particularly in the European Union, which is highly dependent on international oil and gas supplies. This factor may exert additional pressure on the euro.
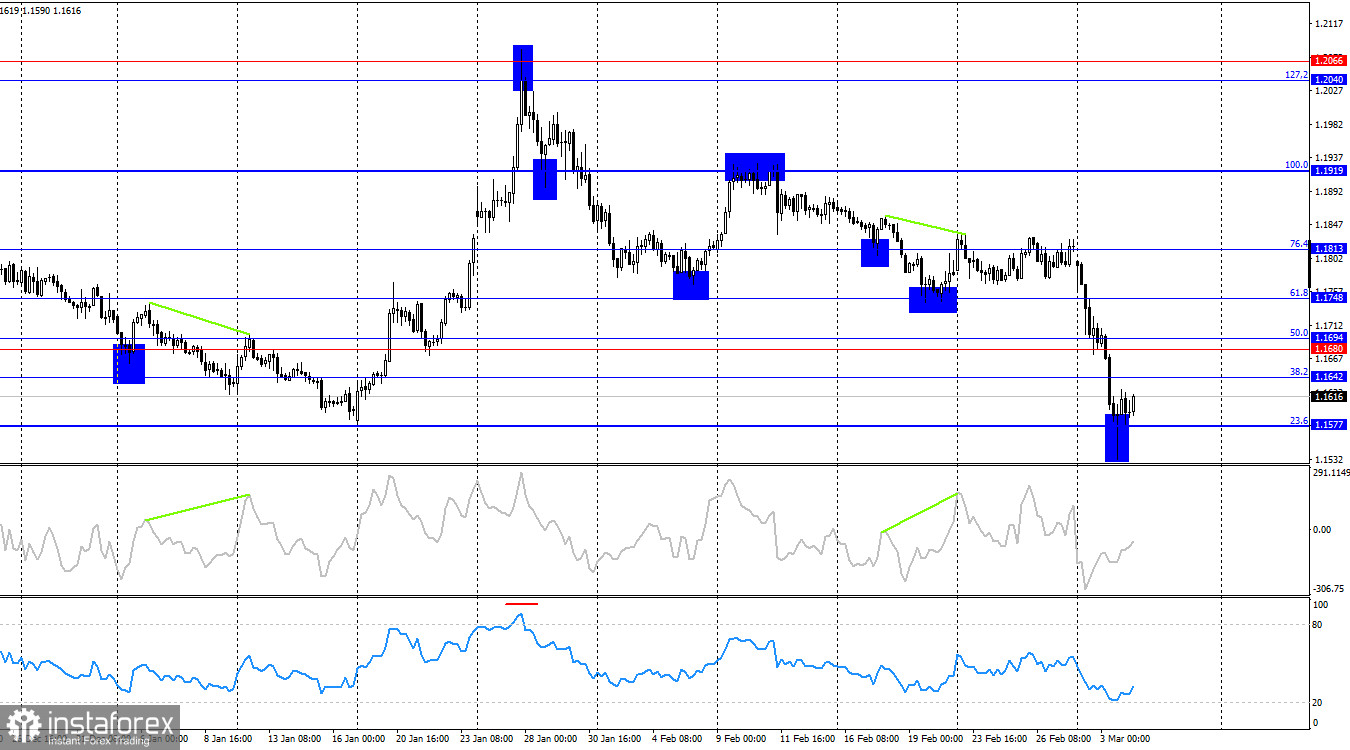
On the 4-hour chart, the pair reversed in favor of the US dollar after a bearish divergence formed on the CCI indicator, and events in Iran allowed the pair to decline toward the 23.6% corrective level at 1.1577. A rebound from 1.1577 would allow traders to expect some growth toward 1.1642 and 1.1680. A consolidation below 1.1577 would increase the probability of further decline toward 1.1471. No new emerging divergences are currently observed on any indicator.
Commitments of Traders (COT) Report:
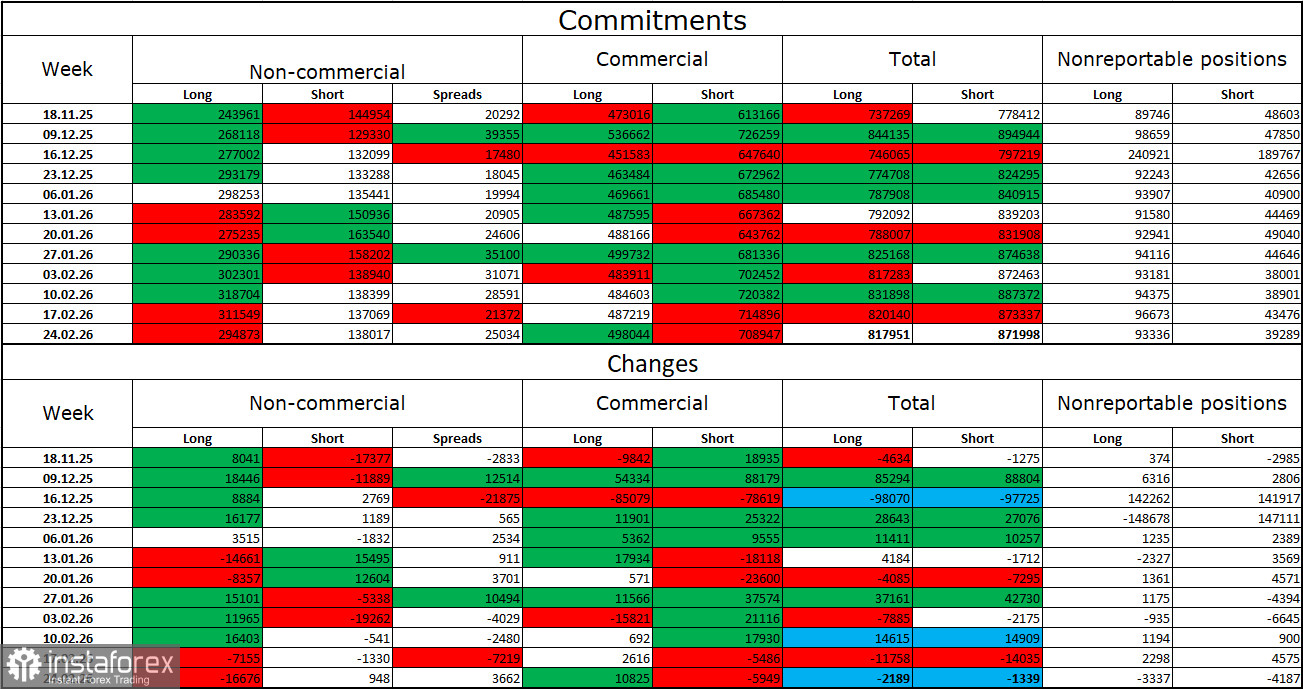
During the latest reporting week, professional traders closed 16,676 long positions and opened 948 short positions. The sentiment of the "Non-commercial" group remains bullish thanks to Donald Trump and his policies, but in recent weeks we have observed a reduction in long positions. The total number of long positions held by speculators now stands at 294,000, while short positions total 138,000. The bulls' advantage remains more than twofold.
Overall, in the long term, large players continue to reduce short positions and increase long ones. Undoubtedly, various global events — which have been plentiful in recent years — exert differing influences on investors. At present, the market's full attention is focused on the Middle East, where the war continues to escalate and expand geographically. Thus, in the near term, the exchange rate of the euro and the dollar will depend not on Donald Trump's policies, but on the war in Iran.
News Calendar for the US and the European Union:
- European Union – Unemployment Rate (10:00 UTC).
- US – ADP Employment Change (13:15 UTC).
- US – ISM Services PMI (15:00 UTC).
On March 4, the economic calendar contains three noteworthy entries, but once again the economy may remain overshadowed by geopolitics. The influence of the news background on market sentiment on Wednesday will almost certainly be present.
EUR/USD Forecast and Trading Tips:
Selling opportunities were available after a rebound on the hourly chart from 1.1830, with targets at 1.1770, 1.1696, and 1.1577. All targets have been reached. Today, sell positions can be opened after a close below 1.1577 with a target of 1.1440. Buy positions may be considered in the event of a rebound from 1.1577 with a target of 1.1696.
The Fibonacci levels are drawn from 1.1805–1.1578 on the hourly chart and from 1.1919–1.1471 on the 4-hour chart.