 English
  Русский
 Bahasa Indonesia
 Bahasa Malay
 ไทย
ไทย Español
 Deutsch
 Български
 Français
 Tiếng Việt
 中文
中文 বাংলা
বাংলা हिन्दी
 Čeština
 Українська
 Română

In the fast-moving world of digital finance, a paradigm shift is underway in how digital assets are used. Representatives of Franklin Templeton, a respected investment firm, said in a recent report that companies are increasingly acquiring XRP not for speculative trading but as an integral component for building real financial infrastructure. The emphasis is shifting toward practical applications such as efficient cross?border payments and asset tokenisation — areas in which the company specialises.
It's no secret to many that the XRP Ledger, on which the XRP token runs, demonstrates a strong ability to integrate with the existing financial system. Its architecture — geared to ultra?fast settlement and minimal transaction costs — makes it an attractive solution for financial institutions seeking to streamline operations. This trend suggests that XRP is gradually transforming from a purely tradable asset into a fundamental, infrastructural element designed to solve concrete fintech problems.
Moreover, the expected alignment of regulatory approaches between the US Securities and Exchange Commission and the Commodity Futures Trading Commission — a process that is actively being discussed — could catalyse a new phase in the development of the crypto market. That, in turn, would open the door to broader adoption of XRP and other digital assets within the global financial architecture, affirming their potential as powerful tools for industry transformation.
Trading recommendations
Bitcoin
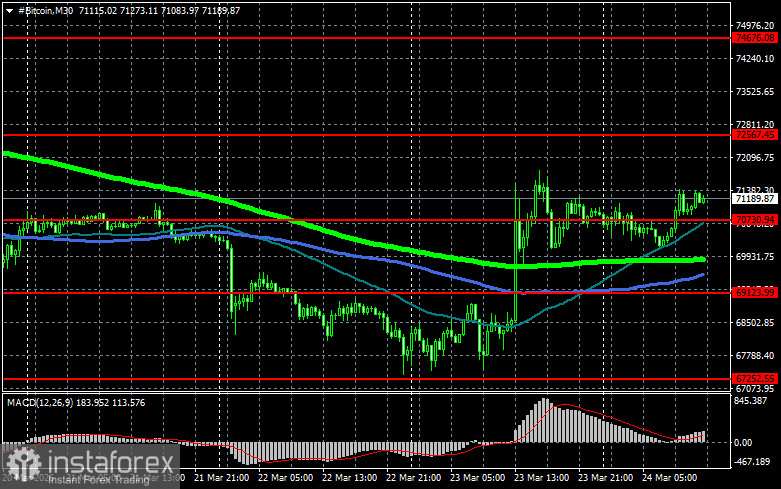
Buyers are currently targeting a return to $72,500, which would open a direct path to $74,600 and then to $76,500. The more distant upside target is around $78,400; a break above that point would indicate attempts to resume the bull market. On the downside, buyers are expected at $70,700. A move back below that area could quickly push BTC toward $69,200, with a further downside target near $67,200.
Ethereum
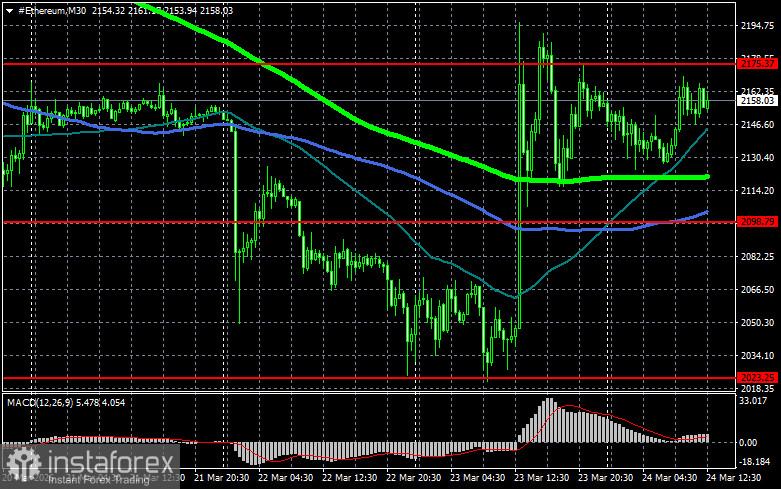
A clear close above $2,175 would open the way to $2,238. The more distant upside target is around $2,296; a break above that would signal strengthening bullish sentiment and renewed buyer interest. On the downside, buyers are expected at $2,098. A move below that area could quickly send ETH toward $2,023, with a further downside target near $1,915.
What's on the chart
- The red lines represent support and resistance levels, where price is expected to either pause or react sharply.
- The green line shows the 50-day moving average.
- The blue line is the 100-day moving average.
- The lime line is the 200-day moving average.
Price testing or crossing any of these moving averages often either halts movement or injects fresh momentum into the market.