 English
  Русский
 Bahasa Indonesia
 Bahasa Malay
 ไทย
ไทย Español
 Deutsch
 Български
 Français
 Tiếng Việt
 中文
中文 বাংলা
বাংলা हिन्दी
 Čeština
 Українська
 Română

Trade Analysis for Friday:
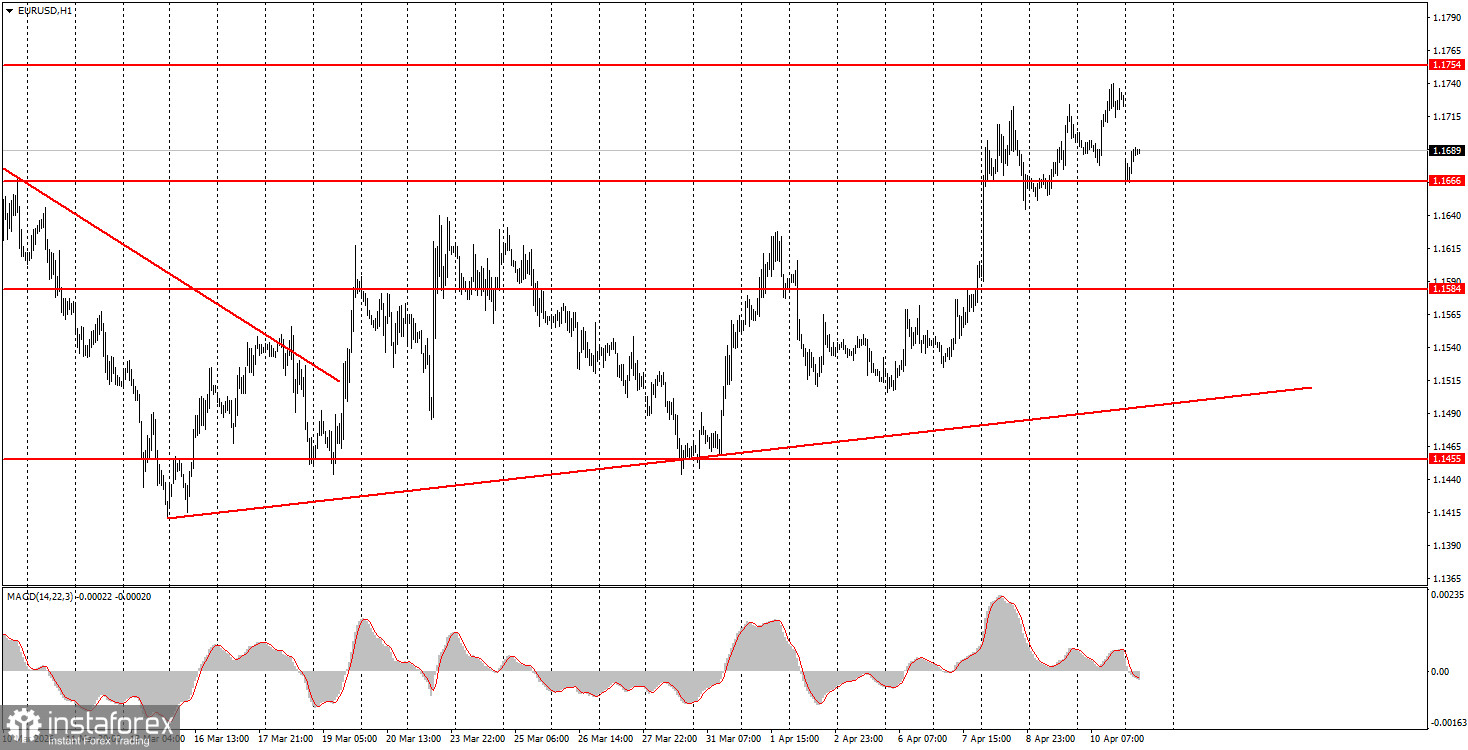
1H Chart of the EUR/USD Pair
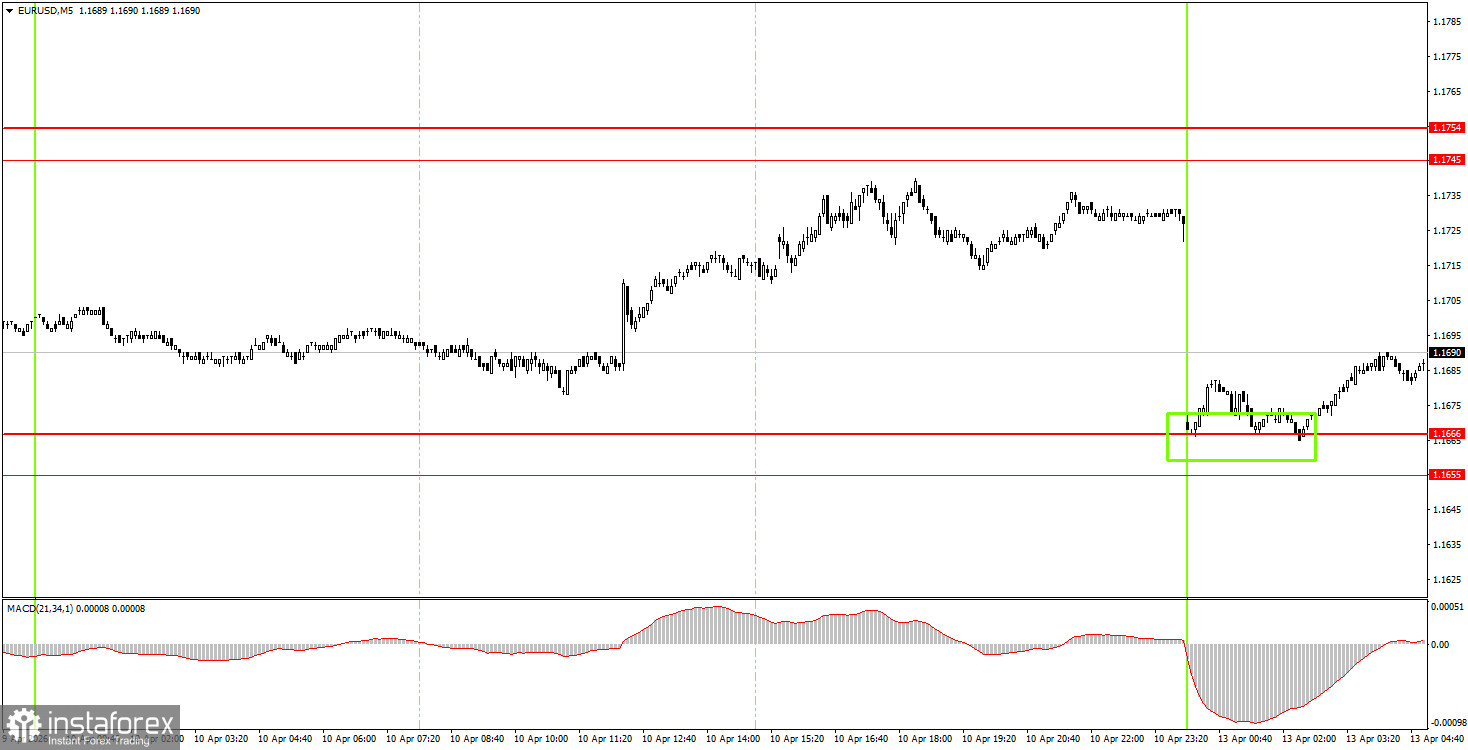
5M Chart of the EUR/USD Pair
How to Trade on Monday:
On the hourly timeframe, the upward trend remains intact, but geopolitical factors may pull the pair down again this week. The market is continuing to trade solely on events in the Middle East and emotions. Thus, the "roller coaster" may continue for quite a while, and macroeconomic, technical, and fundamental factors are of little significance. The failure of negotiations between Iran and the US may mean the dollar is prioritized again by traders.
On Monday, novice traders may consider short positions if the price consolidates below the 1.1655-1.1666 area, targeting 1.1584-1.1591. A new price bounce from the 1.1655-1.1666 area will allow for the opening of long positions with a target of 1.1745-1.1754.
On the 5-minute timeframe, levels to consider are 1.1267-1.1292, 1.1354-1.1363, 1.1413, 1.1455-1.1474, 1.1527-1.1531, 1.1584-1.1591, 1.1655-1.1666, 1.1745-1.1754, 1.1830-1.1837, and 1.1899-1.1908. On Monday, there are no significant events or reports scheduled in the Eurozone, and in the US, only a secondary report on existing home sales will be released. Market attention will once again be entirely focused on geopolitical factors.
Key Principles of the Trading System:
- The strength of the signal is determined by the time it took to form the signal (bounce or level breakthrough). The shorter the time, the stronger the signal.
- If two or more trades were opened around any level based on false signals, all subsequent signals from that level should be ignored.
- In a range, any pair can generate a lot of false signals or may not generate them at all. Technical levels may be ignored.
- On the hourly timeframe, it is advisable to trade MACD signals only when volatility is good, and the trend is confirmed by a trendline or trend channel.
- If two levels are located too close together (5-20 pips apart), they should be considered a support or resistance area.
- After moving 15 pips in the correct direction, a Stop Loss should be set to breakeven.
What to Look for on the Charts:
Price levels of support and resistance are levels that serve as targets when opening buys or sells. Take Profit levels can be placed around them.
Red lines represent channels or trend lines that show the current trend and indicate the direction in which it is preferable to trade now.
The MACD indicator (14,22,3) – the histogram and the signal line – is a supporting indicator that can also be used as a source of signals.
Important speeches and reports (always included in the news calendar) can significantly affect the movement of the currency pair. Therefore, during their release, trading should be done with utmost caution, or traders should exit the market to avoid sharp price reversals against the previous movement.
Beginning traders in the forex market should remember that not every trade can be profitable. Developing a clear strategy and effective money management are the keys to long-term trading success.