 English
  Русский
 Bahasa Indonesia
 Bahasa Malay
 ไทย
ไทย Español
 Deutsch
 Български
 Français
 Tiếng Việt
 中文
中文 বাংলা
বাংলা हिन्दी
 Čeština
 Українська
 Română

Analysis of EUR/USD 5M
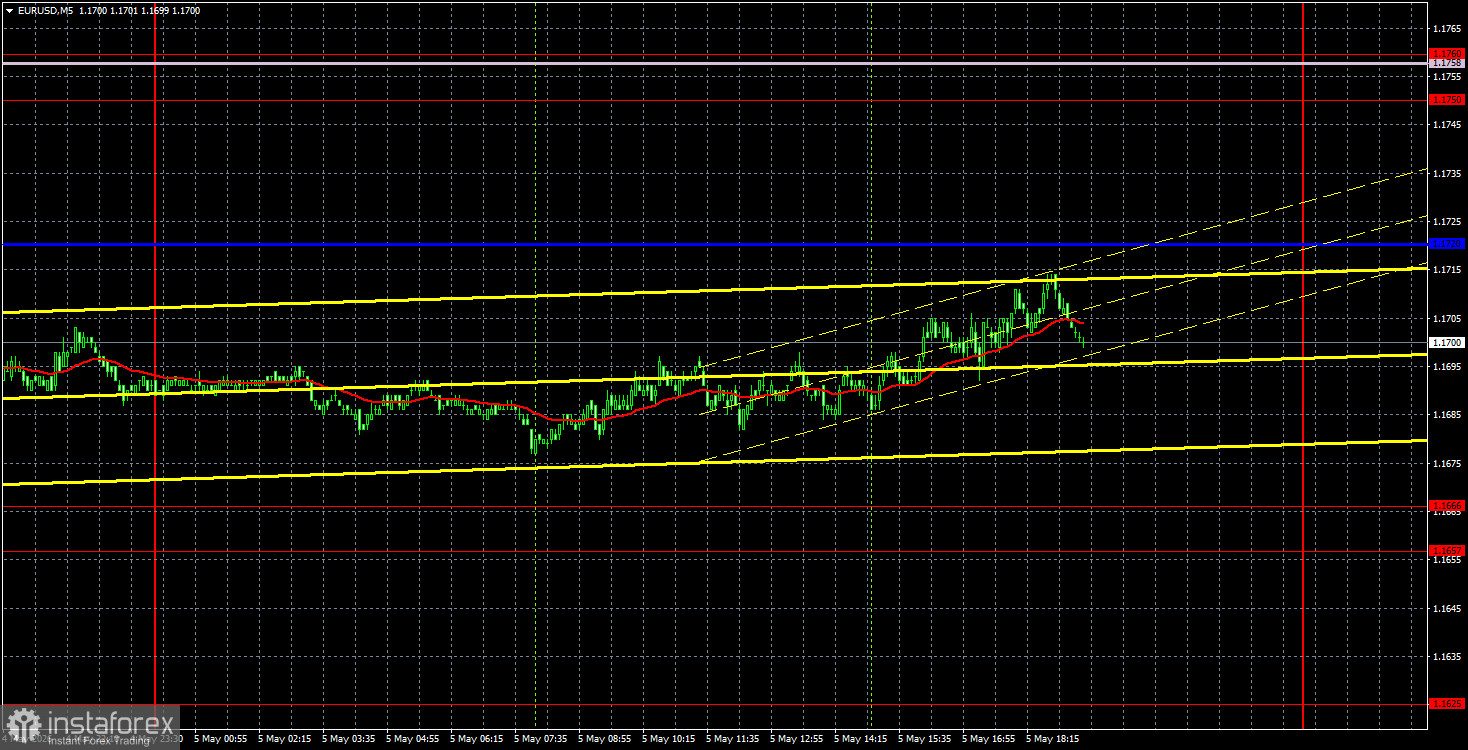
The EUR/USD currency pair exhibited "super volatility" on Tuesday, not exceeding 40 pips. Throughout the day, no geopolitical news was reported, but two quite significant reports from the US were published, along with another speech by European Central Bank President Christine Lagarde. Initially, we did not expect anything discouraging from Lagarde's speech, and the market could have reacted to the macroeconomic data from across the ocean. However, it preferred to ignore them once again. The ISM Services sector activity index for April was 53.6, down 0.4 points from the previous month and 0.1 points below expectations. The JOLTs report for March showed 6.866 million job openings, roughly in line with forecasts. In any case, we believe that the ISM index is more important, but during the American session, volatility was only 27 pips. It is clear that the market barely noted the American reports.
On the hourly timeframe, sideways movement continues. The pair broke through the ascending trend line a week ago but has since remained in a sideways channel. The dollar lacks sufficient reasons for a full trend even on the hourly timeframe. Without significant deterioration in the geopolitical situation or strong data from the US labor market, we do not expect a breakout above the 1.1657-1.1666 area.
On the 5-minute timeframe, no trading signals were formed on Tuesday. Throughout the day, the price did not approach important levels or lines. Thus, traders had no grounds to open new positions.
COT Report
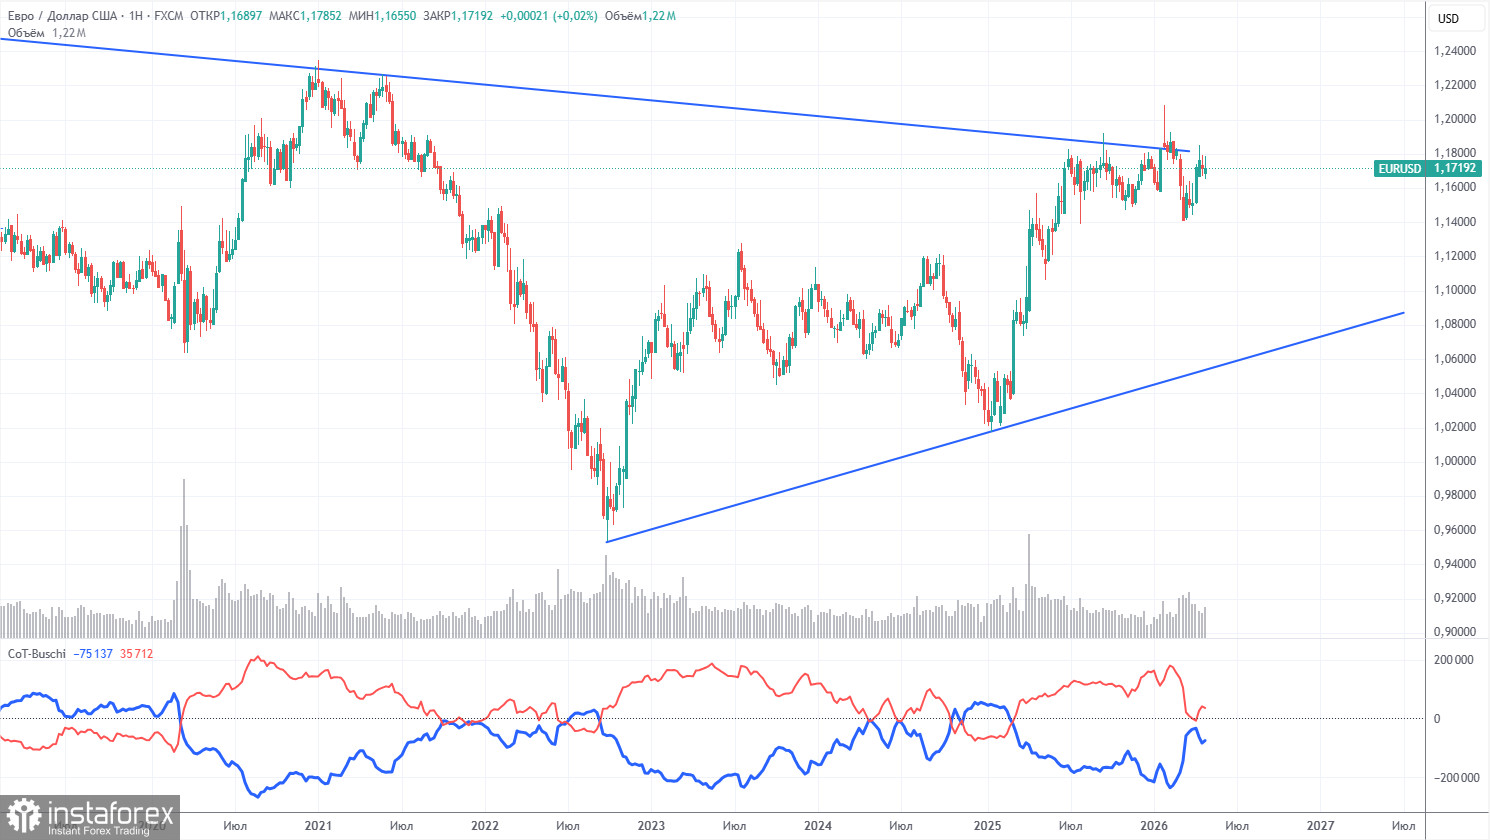
The latest COT report is dated April 28. The illustration on the weekly timeframe clearly shows that the net position of non-commercial traders remains "bullish," but is rapidly declining due to geopolitical events. Traders have been shedding the European currency in favor of the US dollar in recent months. Trump's policies have not changed, but for a period, the dollar has acted as a "reserve currency." However, this process may already be behind us.
We still do not see any fundamental factors that would strengthen the euro, while there are enough factors that would weaken the dollar. The war in the Middle East made the dollar temporarily super attractive, but when this factor reaches its "expiration date," everything will revert to how it was. That expiration may have already occurred. In the long term, the euro could fall to 1.06 (trend line), but the upward trend will still remain relevant. Currently, the pair has not strayed too far from the descending trend line, which has been breached several times.
The positioning of the red and blue lines of the indicator indicates parity between bulls and bears. Over the last reporting week, the number of long positions in the "non-commercial" group decreased by 300, while the number of shorts increased by 5,300. Consequently, the net position fell by 5,600 contracts over the week.
Analysis of EUR/USD 1H
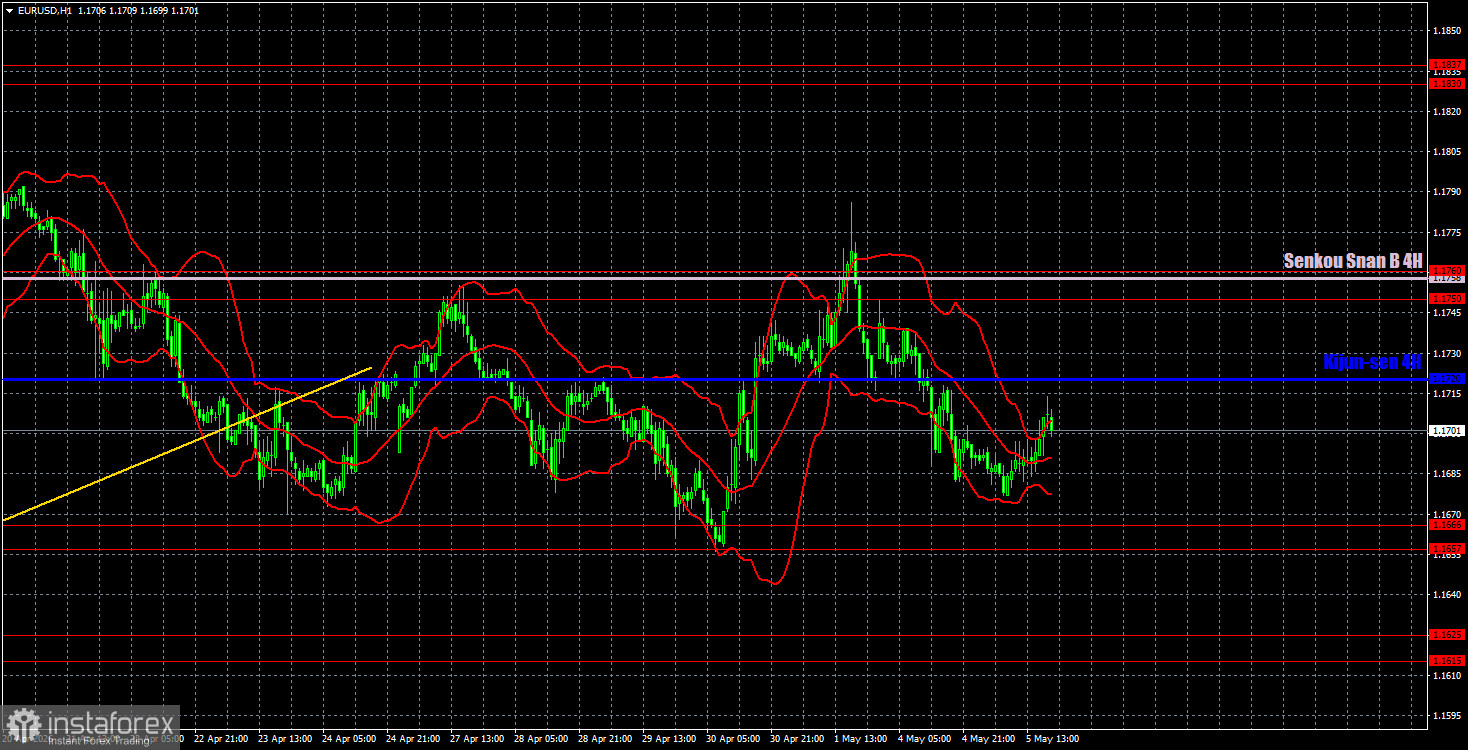
On the hourly timeframe, the EUR/USD pair continues to form a downward trend, but in reality, we have observed a flat market since April 21. The situation in the Middle East remains tense but is not worsening, so there are currently few strong reasons to further strengthen the US dollar. Technically, the dollar is in a more advantageous position than the euro, but this advantage was not realized last week.
For May 6, we highlight the following trading levels: 1.1362, 1.1426, 1.1542, 1.1615-1.1625, 1.1657-1.1666, 1.1750-1.1760, 1.1830-1.1837, 1.1907-1.1922, as well as the Senkou Span B line (1.1758) and the Kijun-sen line (1.1720). The lines of the Ichimoku indicator may shift throughout the day, which should be taken into account when determining trading signals. Don't forget to set a stop loss to breakeven if the price moves in the correct direction by 15 pips. This will protect against potential losses if the signal turns out to be false.
On Wednesday, final values of the activity indices for April will be published in the Eurozone, although these releases are of little interest. In the US, the ADP report on labor market conditions will be released, but it has always been overshadowed by the Nonfarm Payrolls report, which will come out on Friday, along with the unemployment rate.
Trading Recommendations:
Today, traders may consider short positions if the price consolidates below the 1.1657-1.1666 area, targeting 1.1615-1.1625. Long positions can be opened on a price rebound from the area of 1.1657-1.1666, with targets at the Kijun-sen and Senkou Span B lines.
Explanation of Illustrations:
- Support and resistance price levels (resistance/support) – thick red lines around which movement may end. They are not sources of trading signals.
- Kijun-sen and Senkou Span B lines – lines of the Ichimoku indicator transferred to the hourly timeframe from the four-hour. They are strong lines.
- Extremity levels – thin red lines from which the price had previously rebounded. They are sources of trading signals.
- Yellow lines – trend lines, trend channels, and any other technical patterns.
- Indicator 1 on COT charts – the size of the net position of each category of traders.