 English
  Русский
 Bahasa Indonesia
 Bahasa Malay
 ไทย
ไทย Español
 Deutsch
 Български
 Français
 Tiếng Việt
 中文
中文 বাংলা
বাংলা हिन्दी
 Čeština
 Українська
 Română

Analysis of EUR/USD 5M
On Wednesday, the EUR/USD currency pair continued to move as if it were doing someone a favor. Despite several important events over the past day, the market found nothing interesting in them. A day earlier, we noted that, excluding last Friday's movement, the pair remains within a sideways channel. As a result of a 100-pip decline amid strong Nonfarms, the channel simply shifted lower. The nature of the pair's movement has not changed at all: it remains in the same weakly volatile flat. On Wednesday, the US inflation report for May was published. Although the actual figure matched the forecast, the market would not have overlooked the fact that inflation had doubled in three months. Now, the market continues to focus only on geopolitics, and even in that area, it does not react to all news. Yesterday, it became known that Iran launched missiles at some US allies in the region, and Trump effectively acknowledged the breakdown of negotiations. There was also no reaction to these events.
From a technical perspective, the downward trend resumed, but whether it will continue is a big question. If Tehran and Washington somehow sign a deal, demand for the US currency will decline. However, at this time, the parties are much closer to resuming war, so the dollar remains strong across the market.
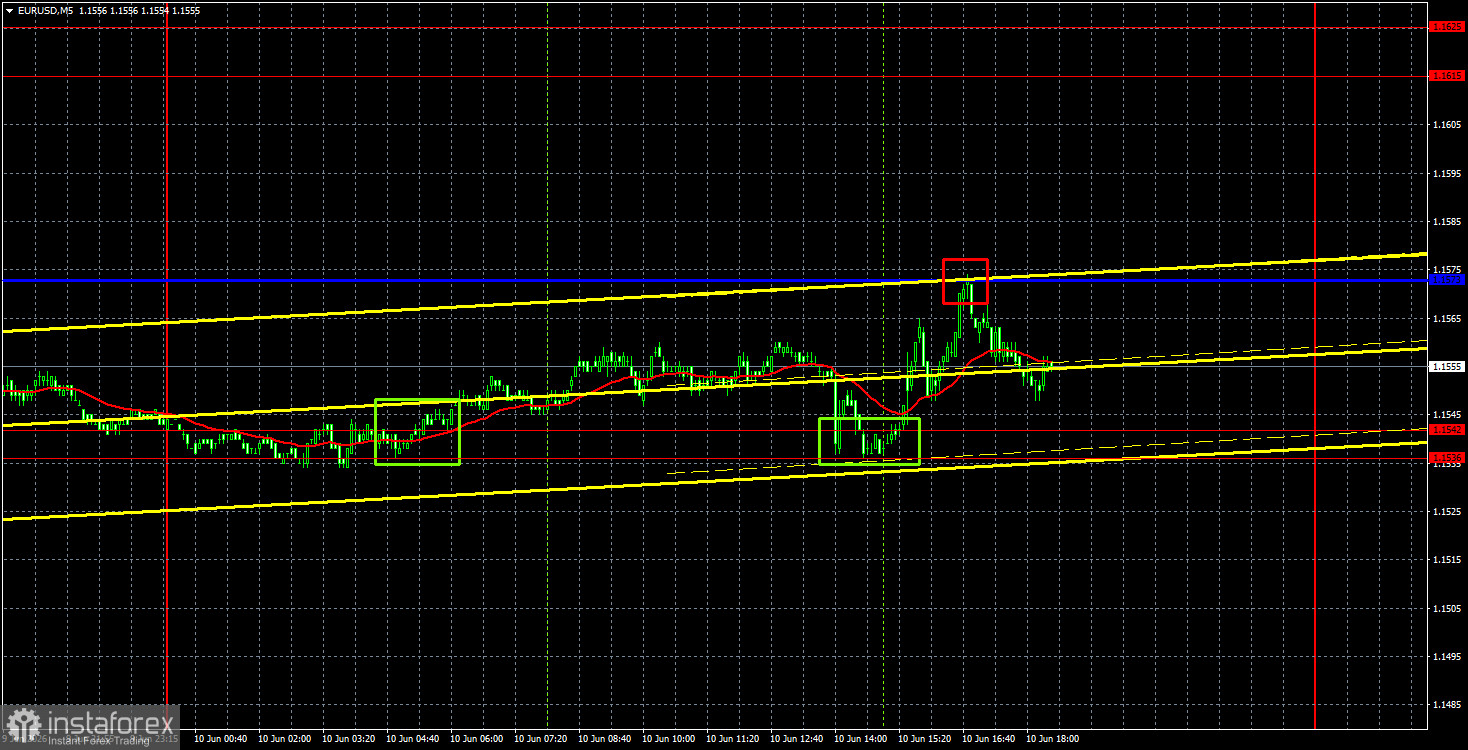
On the 5-minute timeframe on Wednesday, three trading signals were formed. Twice, the price bounced from the area of 1.1536-1.1542, worked through the Kijun-sen line, bounced back from it, and returned to the area of 1.1536-1.1542. Thus, traders had the opportunity to open two profitable trades. However, due to low volatility, the profit was minimal.
COT Report
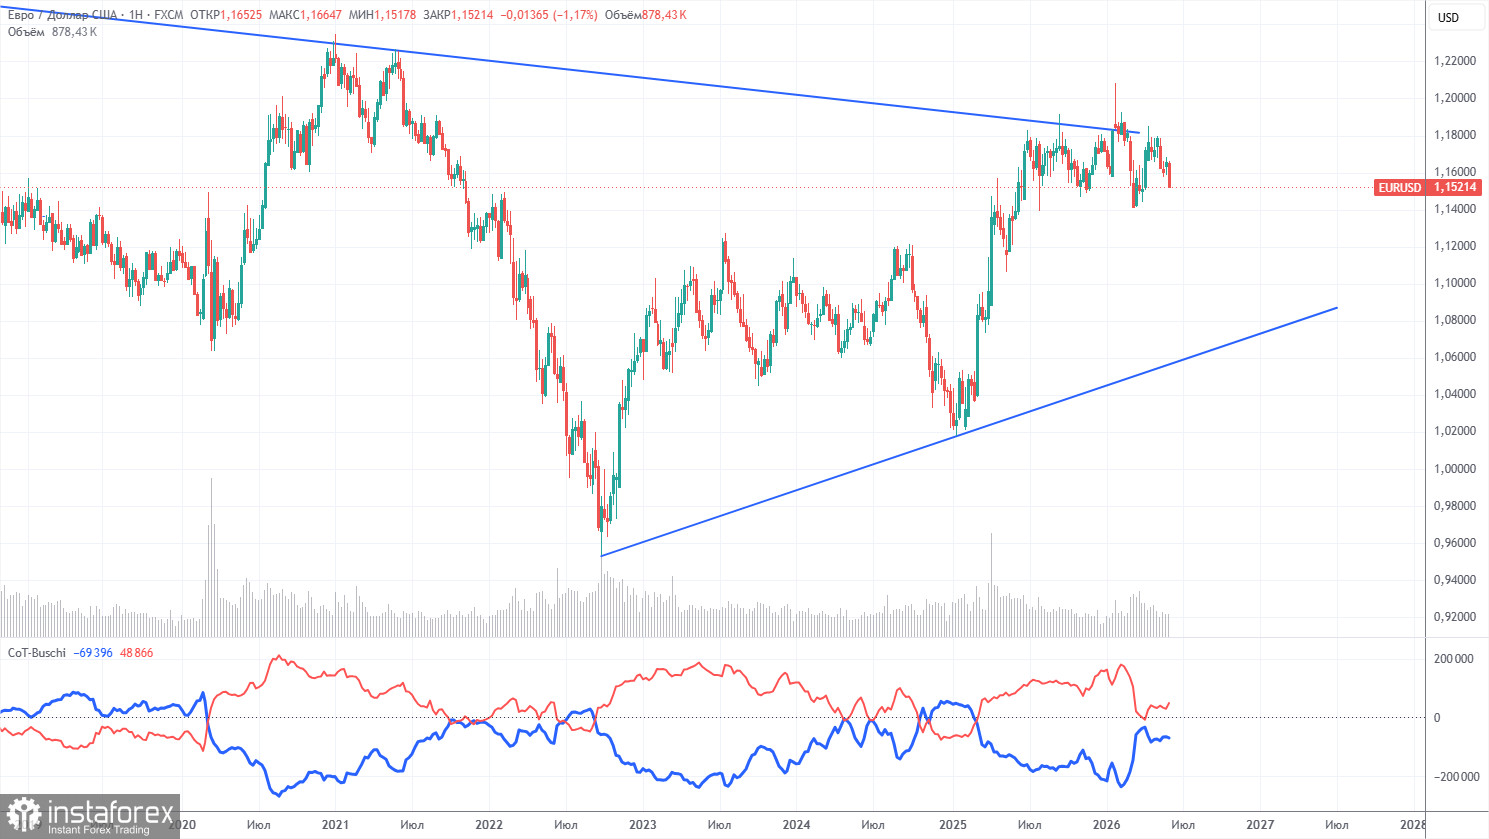
The latest COT report is dated June 2. The weekly timeframe clearly shows that the net position of non-commercial traders remains "bullish" but has declined significantly due to geopolitical events. Traders have been getting rid of the euro in favor of the US dollar in recent months. Donald Trump's policy has not changed, but for a time, the dollar served as a "reserve currency." However, this process may have already concluded.
We still do not see any fundamental factors to strengthen the euro, while there remain enough factors for a decline in the dollar. The war in the Middle East has made the dollar temporarily super-attractive, but once the "expiry date" of this factor passes, everything will return to normal. That date may have already passed. In the long term, the euro could fall to the level of $1.08 (the trend line), but the upward trend will remain relevant. Over the past few months, the pair has not come particularly close to this line.
The positioning of the indicator's red and blue lines indicates parity between bulls and bears. Over the last reporting week, the number of long positions in the "Non-commercial" group increased by 12,400, while the number of shorts decreased by 7,000. Correspondingly, the net position increased by 21,400 contracts over the week.
Analysis of EUR/USD 1H
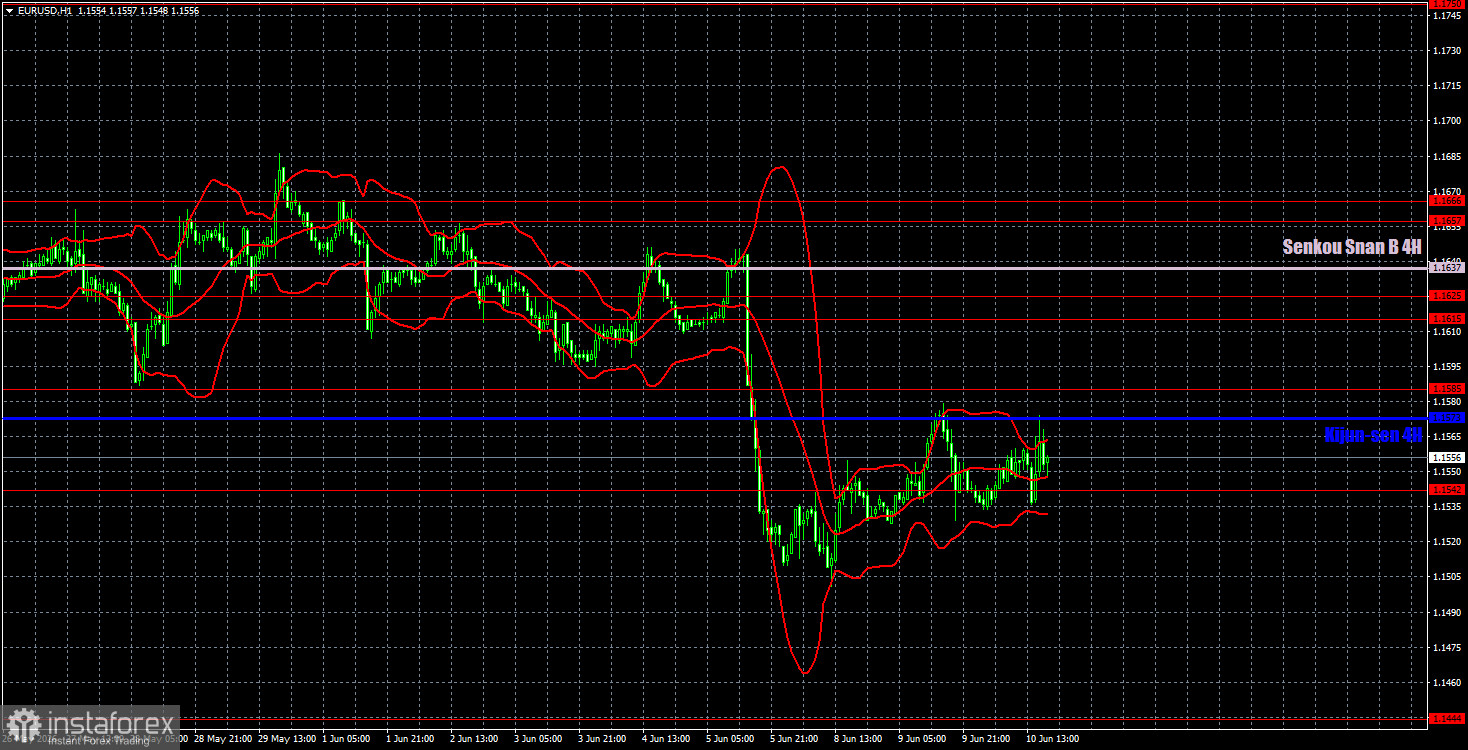
On the hourly timeframe, the EUR/USD pair has resumed its downward trend. The situation in the Middle East remains tense, but there is no resumption of full-scale war, nor any peace deals. Thus, there are currently no sufficient reasons for the dollar to rise, and no significant reasons for the euro to strengthen. However, considering ongoing geopolitical changes, such reasons may emerge.
For June 11, we identify the following levels for trading: 1.1362, 1.1426, 1.1536-1.1542, 1.1585, 1.1657-1.1666, 1.1750-1.1760, 1.1786, 1.1830-1.1837, 1.1907-1.1922, as well as the Senkou Span B line (1.1637) and the Kijun-sen line (1.1573). The Ichimoku indicator lines may shift throughout the day, which should be considered when determining trading signals. Don't forget to set a stop-loss order at breakeven if the price moves in the correct direction by 15 pips. This will protect against potential losses if the signal proves false.
On Thursday, the results of the European Central Bank meeting will be announced, along with a speech by Christine Lagarde. The ECB's decision on rates is already largely known, so we do not expect strong market reactions to this event today. Most likely, the reaction will be formal and will not influence the technical picture or the power dynamics between bulls and bears.
Trading Recommendations:
Today, traders may consider short positions targeting 1.1444 if the price consolidates below the 1.1536-1.1542 area. Long positions can be opened if there is consolidation above 1.1585, targeting 1.1637.
Notes on Illustrations:
Price levels of support and resistance are thick red lines where movement may end. They are not sources of trading signals.
The Kijun-sen and Senkou Span B lines are lines from the Ichimoku indicator shifted to the hourly timeframe from the 4-hour timeframe. They are strong lines.
Extremum levels are thin red lines from which the price previously bounced. They serve as sources of trading signals.
Yellow lines represent trend lines, trend channels, and other technical patterns.
Indicator 1 on the COT charts represents the size of the net position of each category of traders.