 English
  Русский
 Bahasa Indonesia
 Bahasa Malay
 ไทย
ไทย Español
 Deutsch
 Български
 Français
 Tiếng Việt
 中文
中文 বাংলা
বাংলা हिन्दी
 Čeština
 Українська
 Română

Bitcoin has been trading below the average aggregate cost of mining for five consecutive months — that level now sits at $78,000. This means miners on average are selling Bitcoin for less than it costs them to produce it, and roughly 20% of industry participants are operating at a direct loss, forced to sell coins into the market to cover operating expenses.

The result is predictable: less efficient miners shut down operations, the hash rate falls, and mining difficulty declines accordingly. Last week, difficulty plunged 10% — the second-largest drop since January this year. For the market, this is a two-edged signal: on one hand, forced miner sell-offs create constant downward pressure on price. On the other hand, miner capitulation has historically preceded the end of bear cycles.
JPMorgan believes the current weakness could act as a contrarian buy signal for Bitcoin. The logic is classic cycle theory: when miners capitulate and leave the market, bitcoin supply from that source falls sharply. The remaining players — more efficient and lower-cost — continue operating but sell less. A 10% weekly drop in difficulty means weak players are already exiting — so one of the main sources of forced supply is starting to dry up. This aligns with other signals we've noted earlier: long-term holder transfers to exchanges have fallen to their lowest level since 2015, and the share of supply trading at a loss has reached 50% — another historical sign of capitulation.
The aggregate picture is mixed — but that is precisely what a cycle bottom looks like in real time, not in hindsight.
Trading recommendations
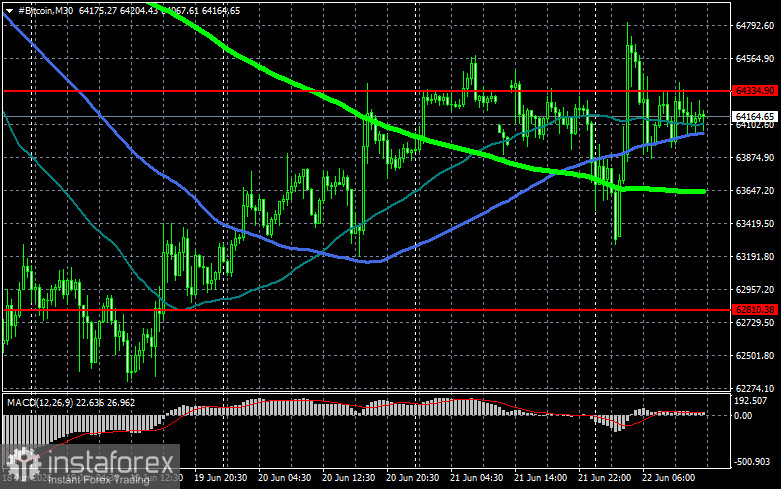
Bitcoin
Buyers are currently targeting a return to $64,300, which would open a direct path to $66,000 and put $67,700 within reach; a break above that level would signal attempts to restore a bull market. On the downside, buyers are expected around $62,800. A move back below that area could quickly push BTC toward $61,200. The furthest downside target is $59,600.
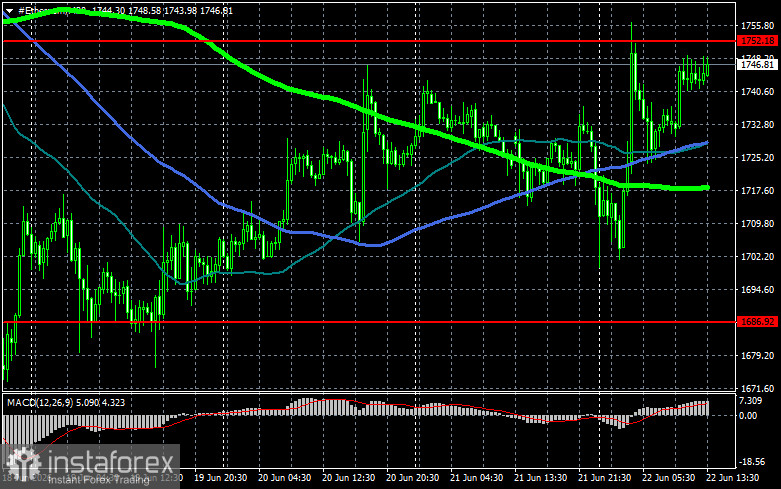
Ethereum
A clear hold above $1,752 would open a direct path to $1,838. The more distant target is the high near $1,901; a break above that would indicate strengthening bullish sentiment and a return of buyer interest. On the downside, buyers are expected at $1,686. A move back below that level could quickly push ETH toward $1,615. The furthest downside target is $1,557.
What's on the chart
- The red lines represent support and resistance levels, where the price is expected to either pause or react sharply.
- The green line shows the 50-day moving average.
- The blue line is the 100-day moving average.
- The lime line is the 200-day moving average.
Price testing or crossing any of these moving averages often either halts movement or injects fresh momentum into the market.