 English
  Русский
 Bahasa Indonesia
 Bahasa Malay
 ไทย
ไทย Español
 Deutsch
 Български
 Français
 Tiếng Việt
 中文
中文 বাংলা
বাংলা हिन्दी
 Čeština
 Українська
 Română

Analysis of EUR/USD 5M
The EUR/USD currency pair continued to trade according to its own rules. After a significant drop in quotes immediately following the Federal Reserve meeting and over the course of a week and a half, it was time for a correction. We still believe that the recent spiral in the US dollar's growth was illogical. Moreover, any continued rise in the US dollar would be illogical, as the war in the Middle East has, after all, ceased, the Strait of Hormuz is more or less open, and oil prices have fallen to pre-war levels. Additionally, the European Central Bank has begun tightening its monetary policy. However, the market disregards all these factors and continues to buy dollars. Regarding yesterday, Germany's inflation report might have triggered the euro's decline. Meanwhile, the JOLTs report in the US could have spurred the rise of the US dollar. However, no movement was observed in the first half of the day, and in the second half, the dollar fell... Thus, macroeconomic data were once again ignored.
From a technical standpoint, the pair remains in in a downward trend, but the euro has chances to rise at least to the Senkou Span B line. Overall, the euro has been falling for two months, despite fundamental and geopolitical factors. There is currently no trend line, and the long-term upward trend remains intact on higher timeframes.
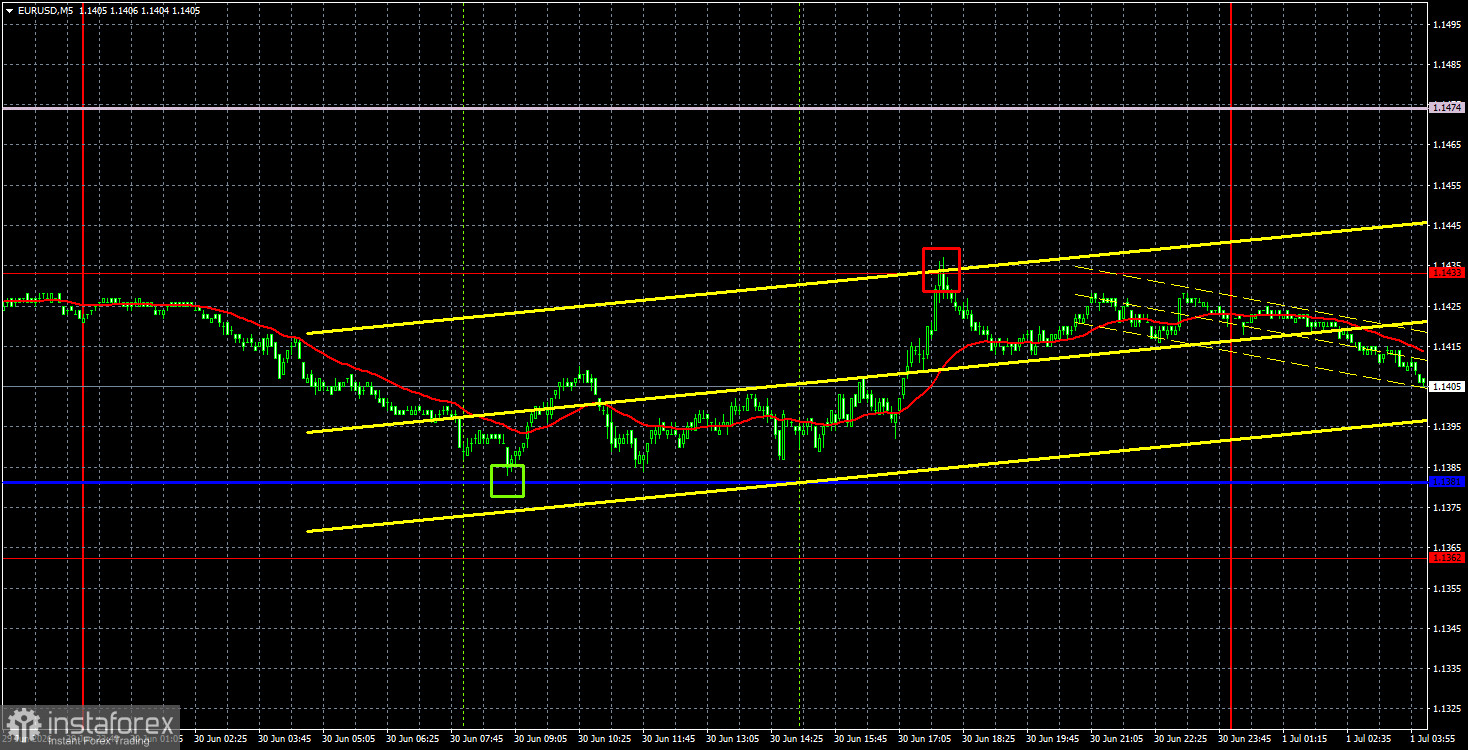
On the 5-minute timeframe, on Tuesday, two trading signals were formed. Initially, the price bounced off the Kijun-sen line with minimal error. During the American session, it rose and reached the level of 1.1433, from which it bounced and began to fall back to the critical line. Thus, traders could open two trades, both of which were profitable.
COT Report
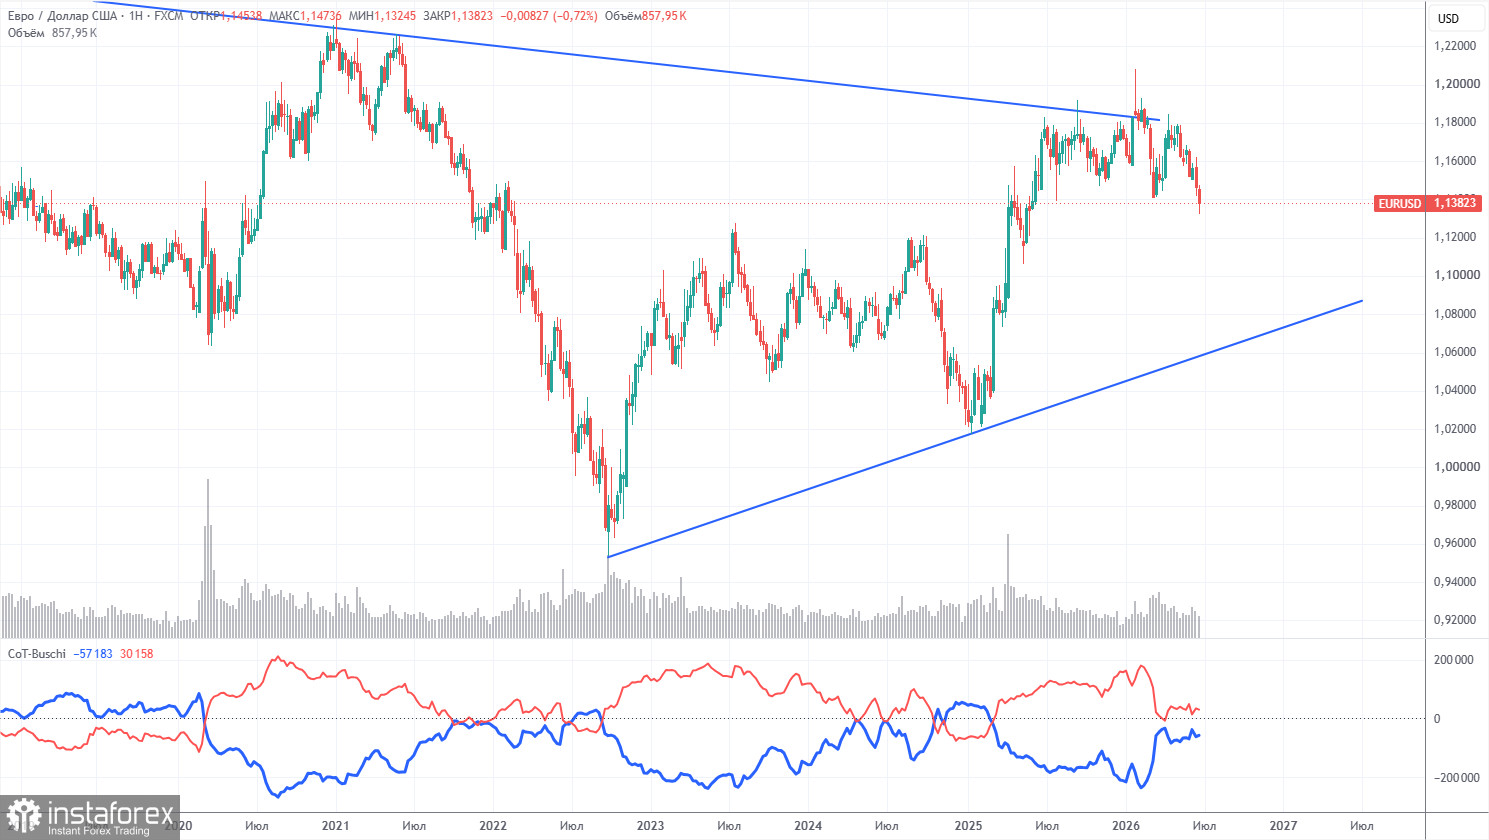
The latest COT report is dated June 23. The illustration on the weekly timeframe clearly shows that the net position of non-commercial traders remains bullish but has declined significantly due to geopolitical events. Traders have been unloading the euro in favor of the US dollar in recent months. Donald Trump's policy has not changed, but the dollar has acted as a "reserve currency" for some time. However, this process may already be coming to an end.
We still do not see any fundamental factors for strengthening the euro, but there are sufficient factors for a decline in the US dollar. The war in the Middle East made the dollar temporarily very attractive, but when this factor's "shelf life" expires, everything will revert to the way it was. And it may have already expired. In the long term, the euro could fall to as low as 1.08$ (the trend line), but the upward trend will still remain relevant. In recent months, the pair has not approached this line significantly.
The positioning of the red and blue lines of the indicator indicates parity between bulls and bears. Over the last reporting week, the number of longs in the "Non-commercial" group increased by 19,300, while the number of shorts grew by 23,500. Consequently, the net position fell by 4,200 contracts over the week.
Analysis of EUR/USD 1H
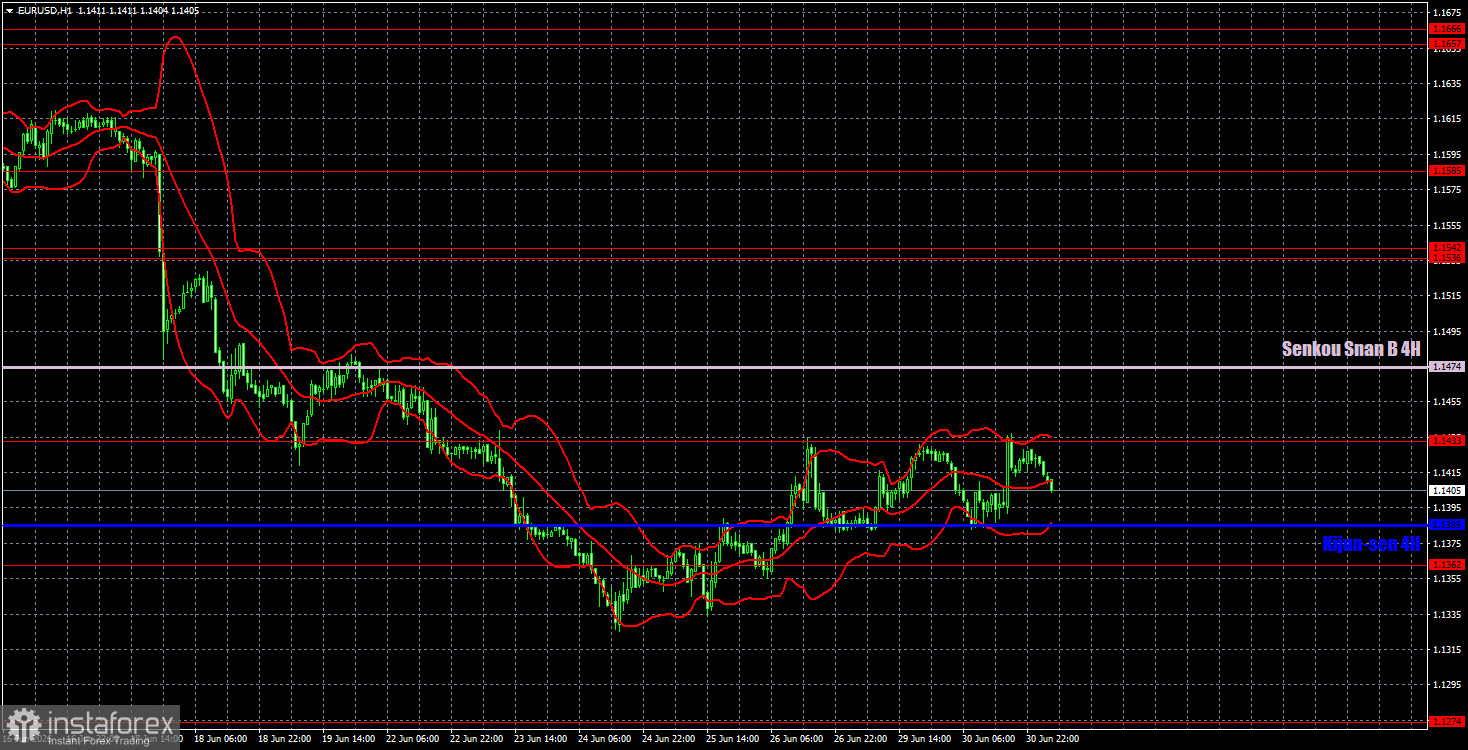
On the hourly timeframe, a strong, unwarranted downward trend continues to develop. The situation in the Middle East remains tense, but we do not consider the ongoing shelling between Iran and the US to be sufficient reason for the dollar to strengthen significantly. The Fed has supported the US currency, but it is difficult to determine why the decline continues. The market continues to buy dollars for no visible reason and ignores all factors in favor of the euro.
For July 1, we highlight the following levels for trading: 1.1234, 1.1274, 1.1362, 1.1433, 1.1536-1.1542, 1.1585, 1.1657-1.1666, 1.1750-1.1760, 1.1786, 1.1830-1.1837, as well as the Senkou Span B line (1.1474) and Kijun-sen line (1.1385). The Ichimoku indicator lines may shift throughout the day, which should be taken into account when determining trading signals. Don't forget to set a Stop Loss order to break even if the price moves in the correct direction by 15 pips. This will protect against potential losses if the signal proves false.
On Wednesday, the Eurozone will release its June inflation report, while the US will publish the ADP and ISM reports, along with speeches from ECB President Christine Lagarde and Fed Chair Kevin Warsh. As the market's attention is currently focused on the Fed, we would pay particular attention to Warsh's speech.
Trading Recommendations:
Today, traders may remain in short positions targeting the Kijun-sen line and 1.1362 following a bounce from 1.1433. Long positions can be opened with targets at 1.1433 and the Senkou Span B line if the pair bounces today from the critical line or the level of 1.1362.
Explanations for the Illustrations:
- Price support and resistance levels are thick red lines around which movement may end. They are not sources of trading signals.
- The Kijun-sen and Senkou Span B lines are Ichimoku indicator lines transferred to the hourly timeframe from the 4-hour timeframe. They are strong lines.
- Extremum levels are thin red lines from which the price has previously bounced. They are sources of trading signals.
- Yellow lines represent trend lines, trend channels, and any other technical patterns.
- Indicator 1 on COT charts shows the size of the net position for each category of traders.