 English
 Русский
 Bahasa Indonesia
 Bahasa Malay
 ไทย
ไทย Español
 Deutsch
 Български
 Français
 Tiếng Việt
 中文
中文 বাংলা
বাংলা हिन्दी
 Čeština
 Українська
 Română


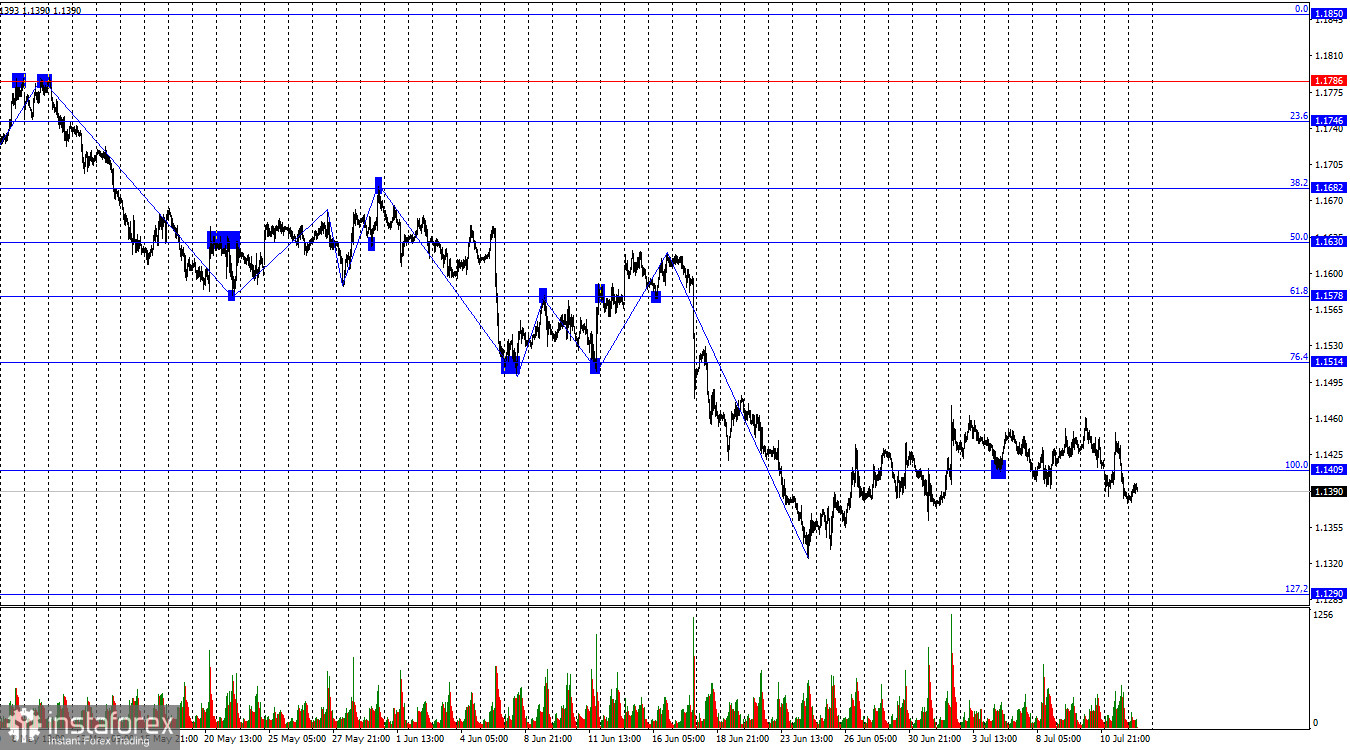
The wave structure on the hourly chart remains bearish despite the bulls' attempts to regain control over the past two weeks. The latest completed downward wave broke below the previous low, while the latest upward wave has not yet surpassed the previous high and is still developing. The geopolitical situation has deteriorated again as Iran and the United States have resumed blockades in the Strait of Hormuz and active military operations. It will only be possible to conclude that the bearish trend has ended after a break above the 1.1620 high or after the formation of two consecutive bullish waves.
The news background on Monday was focused entirely on geopolitical developments, and there were plenty of them. Another Iranian attack on a commercial vessel in the Strait of Hormuz proved to be the final straw for Donald Trump. The U.S. president announced yesterday the resumption of the blockade of Iranian ports, the cancellation of authorization for Iranian oil exports, and the renewal of military strikes against Iran. As a result, all negotiations have effectively been suspended, and the military conflict between Iran and the United States has resumed. Reports also indicate that Washington intends to forcibly reopen the Strait of Hormuz by deploying its naval forces to secure the shipping route. At the same time, Donald Trump plans to charge a fee to any vessel passing through the strait under U.S. military protection. In any case, oil prices are likely to rise again because the strait is currently closed, and in the future, ships may have to pay either Iran or the United States for safe passage. However, if military operations resume in the Persian Gulf, few vessels will be willing to transit the strait.
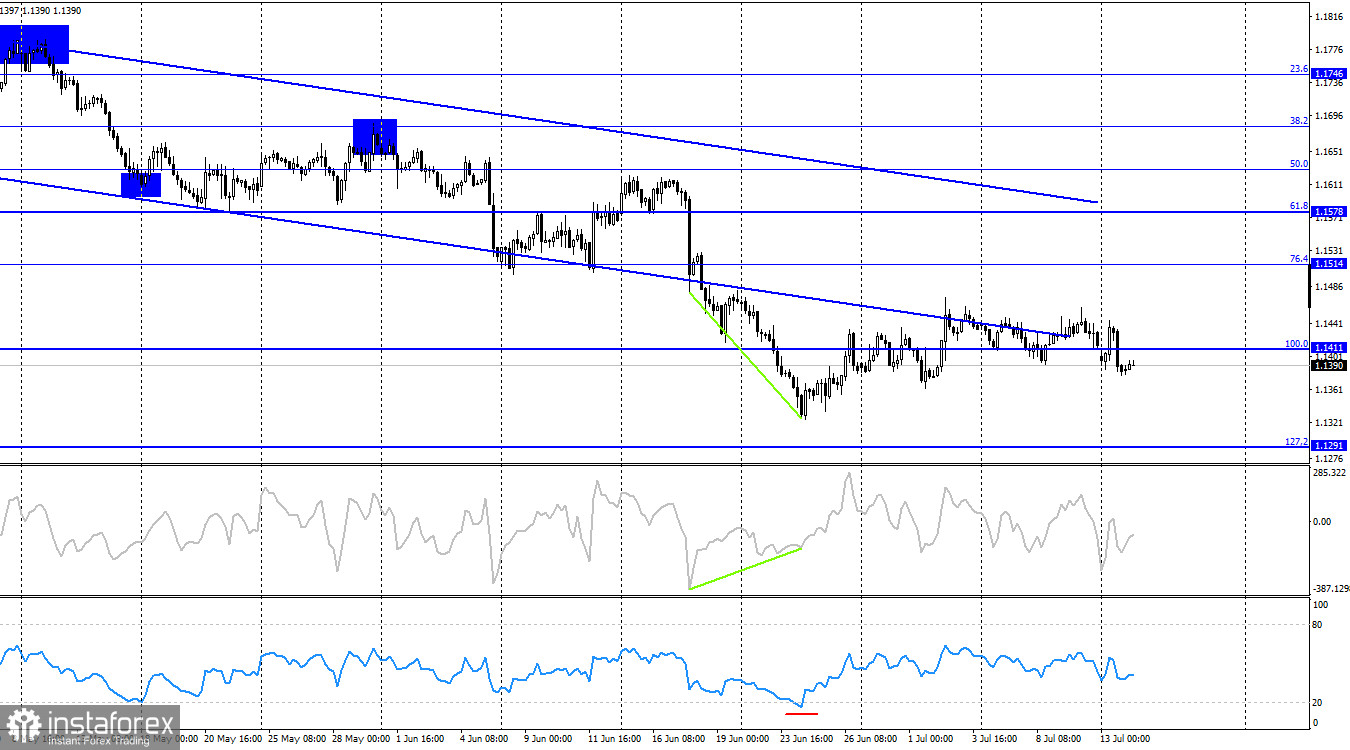
On the 4-hour chart, the pair continues to trade within a sideways range. Consolidation below the 1.1411 level supports expectations of a renewed decline toward the 127.2% Fibonacci retracement level at 1.1291. However, price has been changing direction too frequently recently, while overall trading activity remains subdued. No emerging divergences are currently visible on any indicator. The descending trend channel remains intact.
Commitments of Traders (COT) Report
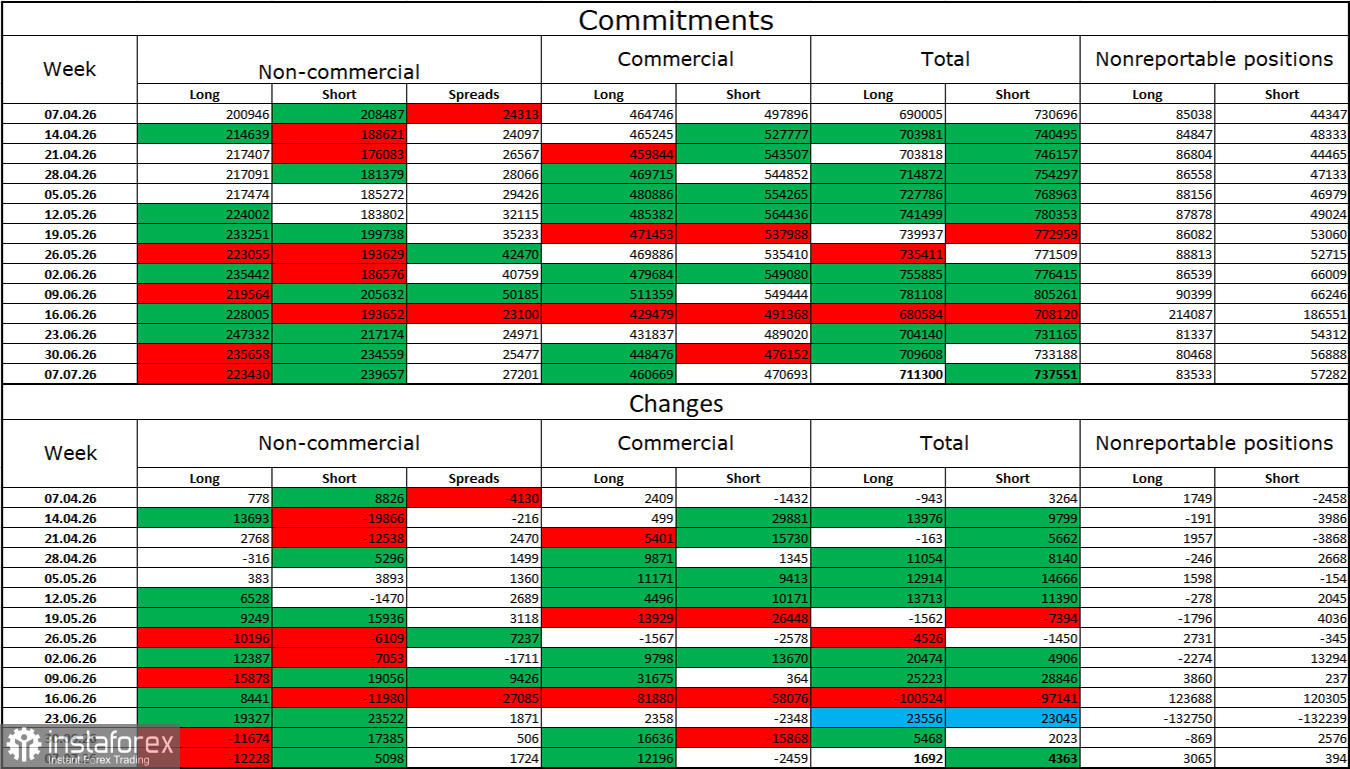
During the latest reporting week, professional traders closed 12,228 long positions and opened 5,098 short positions. During the seven weeks spanning February and March, the bulls' overwhelming advantage disappeared due to the war involving Iran. Over the past fifteen weeks, positioning has become more balanced amid the suspension of hostilities in the Middle East. Speculators currently hold a total of 223,000 long positions and 239,000 short positions.
Overall, from a long-term perspective, large institutional traders continue to view the euro favorably. Naturally, the wide range of global developments seen in recent years continues to influence investor sentiment. In particular, market participants remain focused on developments in the Middle East, where military operations have been suspended and negotiations have begun that could eventually lead to a lasting peace. However, the market continues to largely ignore the improvement in geopolitical conditions, as well as many other factors that support the euro.
Economic Calendar for the United States and the Eurozone
- United States – ADP Employment Change (weekly) (12:15 UTC)
- United States – Consumer Price Index (CPI) (12:30 UTC)
- United States – Speech by Federal Reserve official Kevin Warsh (14:00 UTC)
The economic calendar for July 14 contains three scheduled events, two of which can be considered significant. The impact of the economic news flow on market sentiment is expected during the second half of Tuesday's trading session.
EUR/USD Forecast and Trading Tips
Long positions may be considered after a consolidation above the 1.1409 level on the hourly chart, with a target at 1.1514. Short positions remain possible after a consolidation below the 1.1409 level on the hourly chart, targeting 1.1290. However, current market movements remain extremely weak, and the 1.1409 level has recently proven to be an unreliable source of trading signals.
Fibonacci retracement grids are drawn from 1.1409–1.1850 on the hourly chart and 1.1411–1.1850 on the 4-hour chart.