 English
 Русский
 Bahasa Indonesia
 Bahasa Malay
 ไทย
ไทย Español
 Deutsch
 Български
 Français
 Tiếng Việt
 中文
中文 বাংলা
বাংলা हिन्दी
 Čeština
 Українська
 Română


Bitcoin and Ethereum developed a rapid rally that resumed at the start of the new week. The Treasury's decision to increase the scale of bond buybacks triggered a crypto market surge, but for several days now we have been asking how long it will last given a single supporting factor. In essence, it was a "black swan" that arrived at the most unexpected moment. Despite the strong gains for both cryptocurrencies, we do not believe the downtrend is over. The fundamental backdrop remains weak for the crypto segment. We still see no basis for a sustained rise in Bitcoin and Ethereum. Prospects for the crypto segment have become much more optimistic, but we warn traders: this may be a pump or manipulation.
Meanwhile, one of BitMEX's founders, Arthur Hayes, said that artificial intelligence faces an inevitable collapse, and that bitcoin will rise to $1 million as a result. Hayes noted that investors in AI-related companies and miners do not fully understand what they are putting their money into. People think they are investing in a technological revolution, but in reality much of the money is going into building data centers and energy infrastructure. According to Hayes, the AI boom very strongly resembles the 2008 mortgage crisis. Large companies are investing billions of borrowed dollars in computing power, but whether these investments will pay off is unknown.
Hayes also said that investments are currently flowing into the AI sector on pure enthusiasm and belief in astronomical profits. Sooner or later, market participants will demand proof to justify those expectations. Will AI be able to deliver profits to all participants? If technology giants run into trouble, the U.S. government will be forced to launch new stimulus programs and increase the money supply. As a result, money could flow into other sectors of the economy, including the crypto market. Before a new bull rally begins, bitcoin could still fall into the $50,000–$60,000 range.
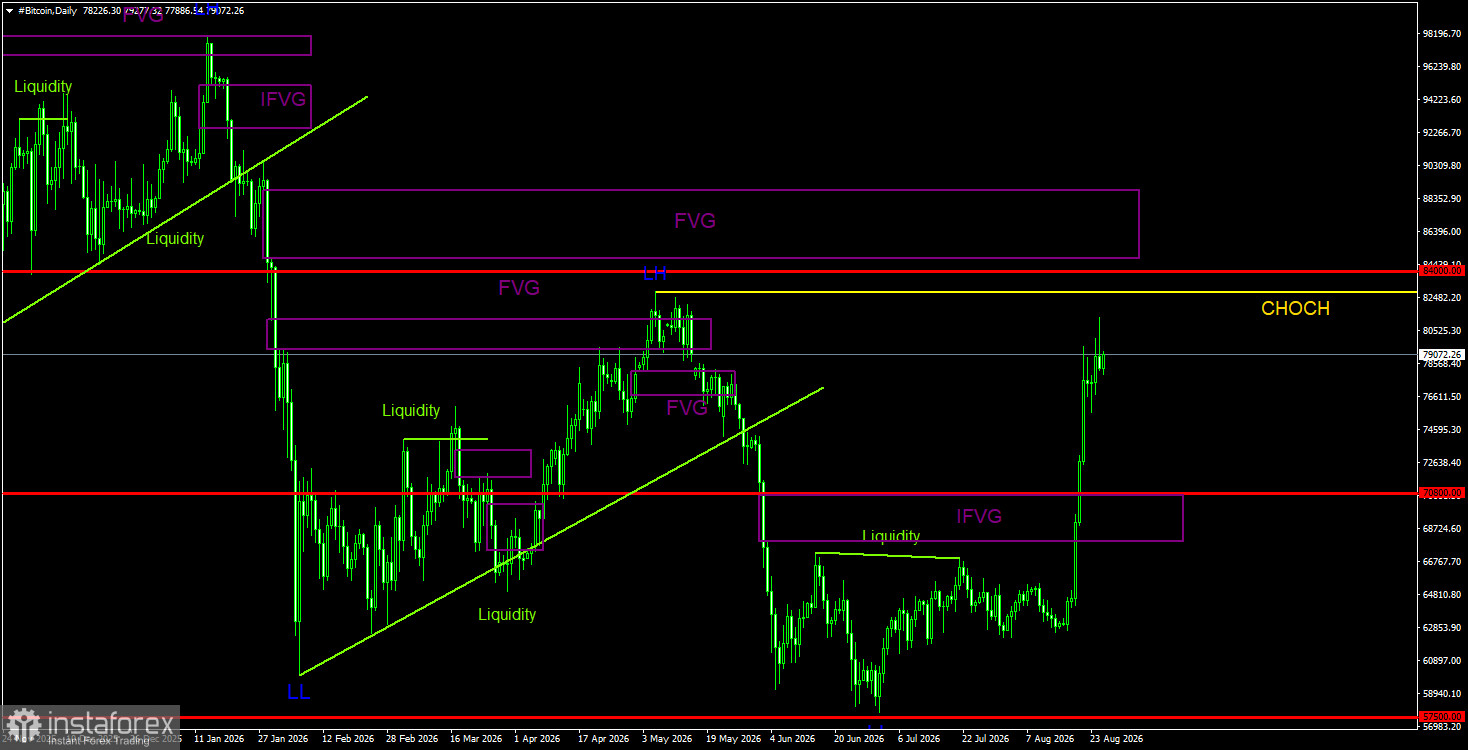
Trading recommendations for BTC/USD
Bitcoin continues to form a downtrend despite the strong rise this week. We continue to expect a decline toward $57,500 (the 61.8% Fibonacci level of the three?year uptrend), although this level has essentially already been tested. We do not believe the downtrend is over. The latest bearish FVG has been invalidated, and POI areas for short positions on higher timeframes have essentially disappeared. However, on the weekly timeframe, the current rise can still be classified as a correction. We understand the current surge in the leading cryptocurrency hardly looks like a correction, but that is not sufficient reason to open longs. The current move most resembles a pump without clear pattern formation or signals. Liquidity may be taken from the $82,850 high, which could trigger a drop in Bitcoin and confirm a shift to sideways movement.
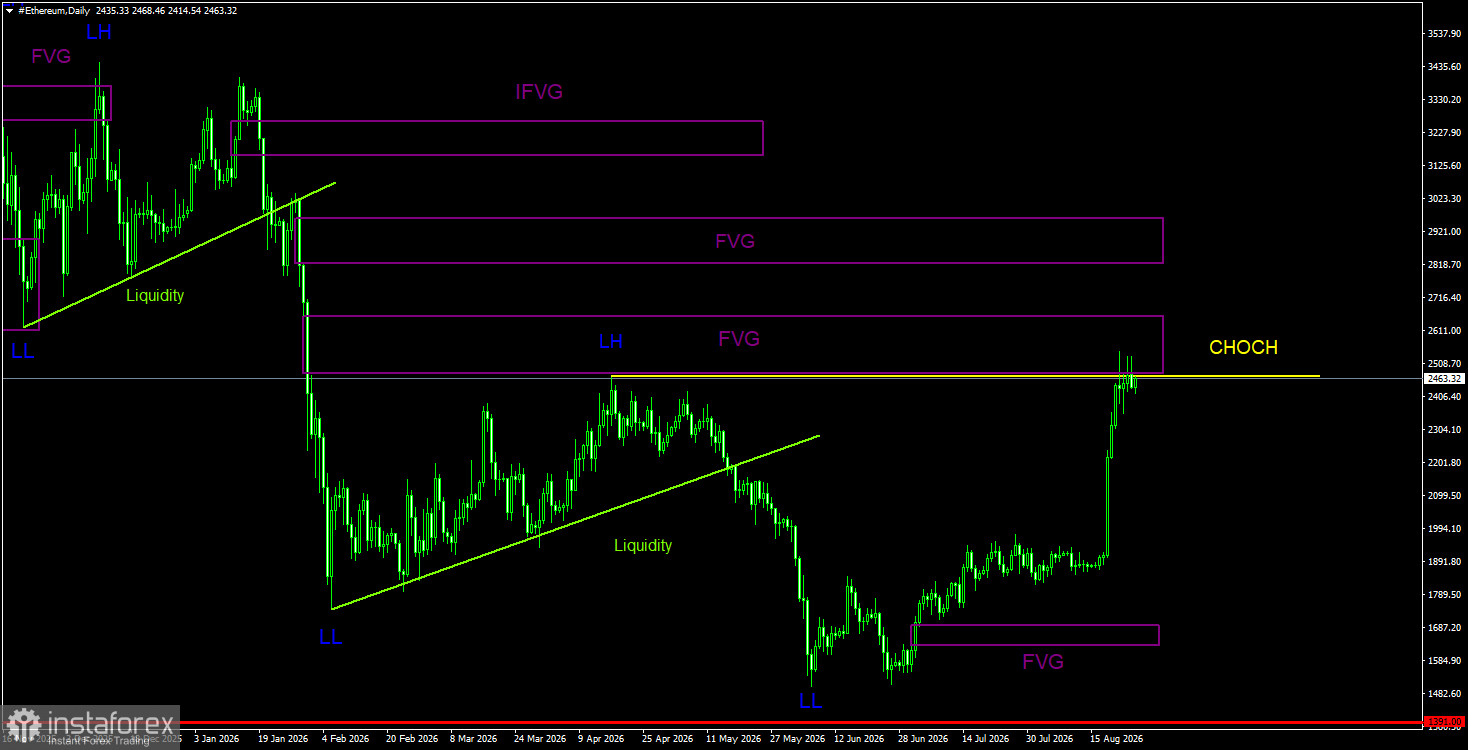
Trading recommendations for ETH/USD
On the daily timeframe, the technical picture has completely changed in just a few days. Ether may now be starting a new uptrend, but there are no valid bullish patterns on the 4?hour or daily charts. Essentially, traders can only rely on the weekly chart, where Ethereum could head toward $4,800 — the upper band of a five?year sideways channel. In any case, to open positions, the market needs to calm down and form new, clear patterns. On the daily timeframe, the nearest bearish FVG has been worked off, but that FVG belongs to the previous trend; if it triggers a market reaction, it will most likely be corrective. Also note the possible liquidity grab from the April 17 high. Bitcoin may soon also remove liquidity from the obvious high and, with some probability, may be trading in a sideways channel.
Comments on the charts
CHOCH is a change of a direction / break of the trend structure. Liquidity means traders' Stop?Losses that market?makers use to build their positions. FVG stands for a Fair Value Gap (area of price inefficiency). The price often moves quickly through such areas, indicating the absence of one side in the market. Later, the price tends to return and react to these zones. IFVG is an Inverted Fair Value Gap. After a return to such a zone, the price does not react but impulsively breaks through and then tests it from the other side.
OB means an Order Block. A candle on which a market?maker opened a position in order to harvest liquidity and then form their own position in the opposite direction.