 English
 Русский
 Bahasa Indonesia
 Bahasa Malay
 ไทย
ไทย Español
 Deutsch
 Български
 Français
 Tiếng Việt
 中文
中文 বাংলা
বাংলা हिन्दी
 Čeština
 Українська
 Română


*See also: InstaForex trading indicators for the S&P 500 (SPX)
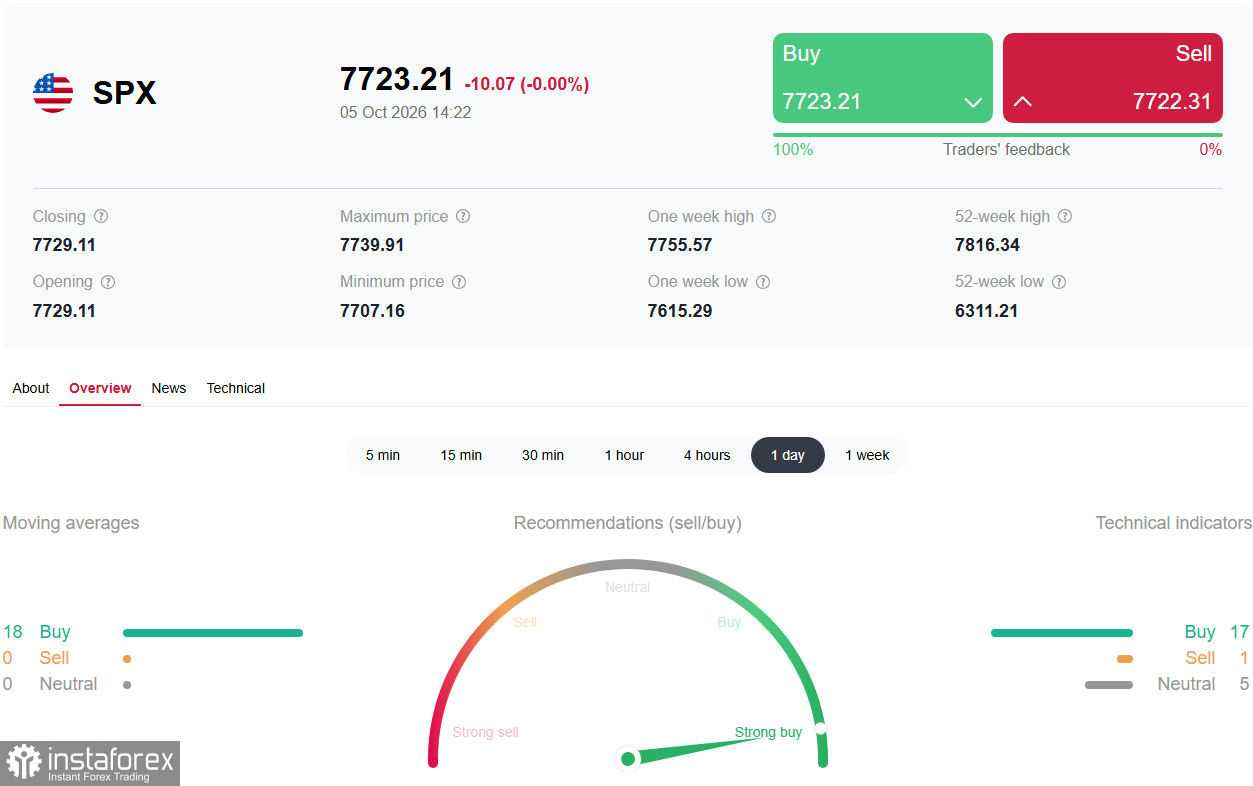
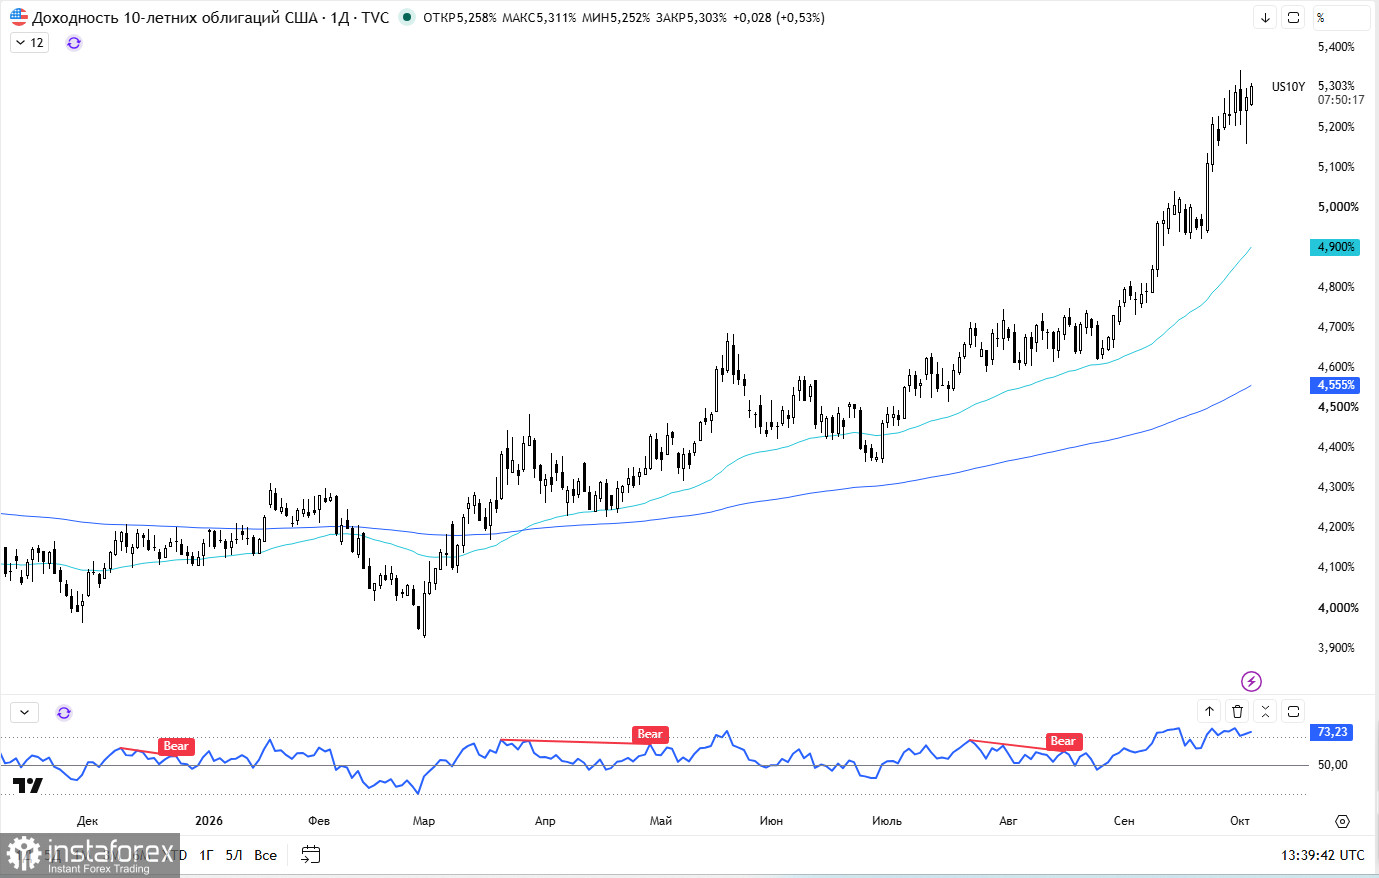
Early in the US session on Monday, the S&P 500 is trading around 7,720.00 after closing Friday up 0.73% at 7,730.00. The market is now pausing ahead of today's ISM services activity release, which could either confirm economic resilience or amplify concerns about slowing. The S&P 500 remains less than 1% from its all-time high even though the 10-year Treasury yield is stuck near 5.30%, a level not seen since 2002.
Friday jobs report
The market finished last week on an upbeat note after a weak NFP print. Nonfarm payrolls rose by just 29,000 in September versus a 90,000 consensus, and July–August revisions trimmed a net 60,000 jobs. The unemployment rate increased to 4.2%, and wage growth slowed to 3.0%, the lowest since May 2021.
The market response was immediate: the probability of an October Fed hike fell from 64% to roughly 20% per CME FedWatch. That relieved some pressure on equities and allowed the S&P 500 its best day in weeks. Yet the dollar remains strong, and Treasury yields persist at elevated levels, creating a mixed backdrop.
What to expect from ISM PMI data
The main question today is whether US services activity remains resilient or signals a slowdown. Consensus expects the index to rise to 55.7 from 55.4 in August. If confirmed, that would reinforce the view of a durable economy despite a weak jobs print.
Two components will be watched closely:
- Employment: the ISM employment component was 47.8 in August — the second month in contraction. If it remains below 50 in September, it would suggest the weak NFP was not a one-off and would heighten concerns about a slowing labor market.
- Prices-paid: the ISM prices-paid index jumped to 72.6 in August — the highest since August 2022. If price pressure holds, it strengthens the case that inflation remains stubborn and could reignite talk of an October hike despite weak payrolls.
Brief technical analysis
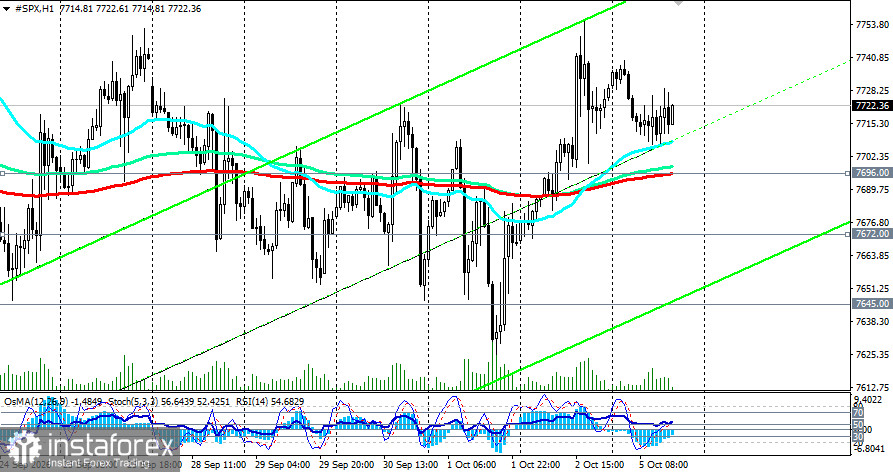
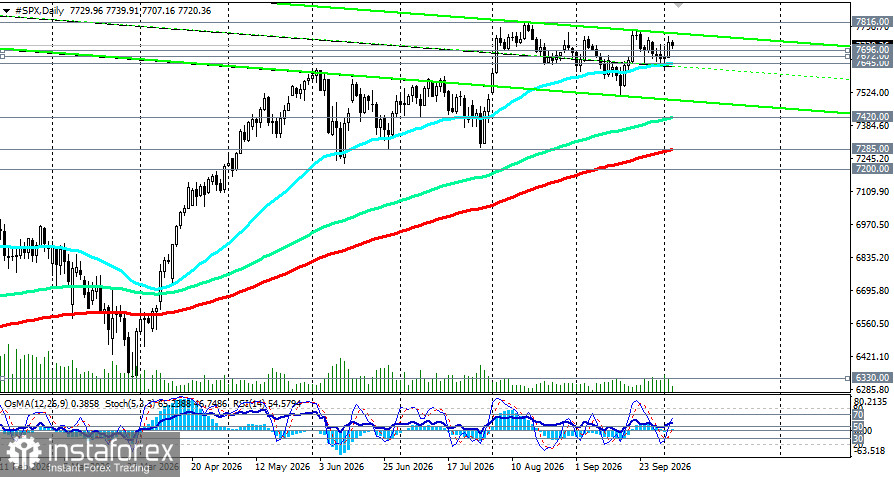
The technical picture for the S&P 500 remains constructive. InstaForex's aggregated technicals (on the daily chart) show a "Strong Buy" signal: 17 of 22 indicators favor long positions.
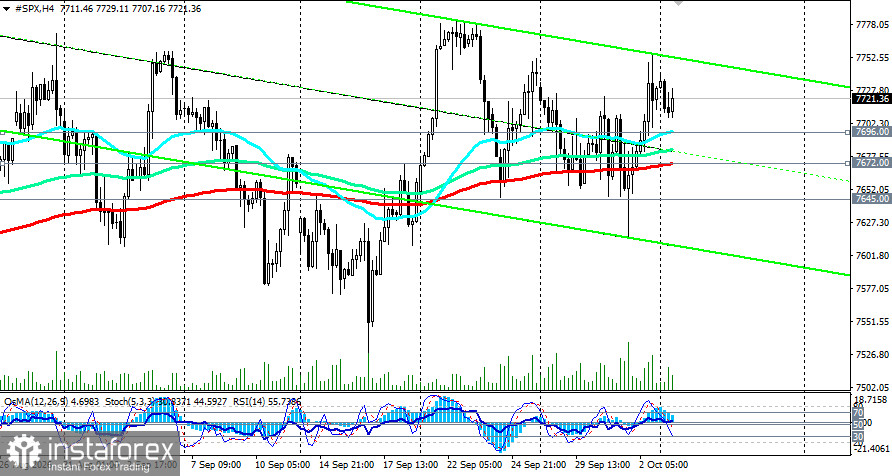
The index is above all key moving averages (50-, 144-, and 200-day), confirming a bullish structure. Breadth and volume, however, raise questions: only about 25% of the largest US stocks are trading above their 50-day MA, and fewer than half are above their 200-day MA. That points to a narrow rally concentrated in tech giants.
Key events to watch
Main question of the day — will ISM services confirm resilience? A print at or above 55.7 would support equities but could re-awaken inflation worries. A disappointing reading could see the S&P 500 test support at 7,672.00 (200-EMA on H4) and 7,645.00 (50-EMA on D1).
Today, October 5, at 14:00 GMT — ISM services PMI for September (key market event). Aside from the headline number, attention will focus on employment and price components.
Wednesday, October 7, at 18:00 GMT — FOMC minutes release. After a weak NFP the market will search for confirmation that the Fed is prepared to pause in October.
Friday, October 9, at 14:00 GMT — preliminary University of Michigan consumer sentiment data. September showed weak sentiment but elevated inflation expectations. A renewed rise in expectations could spark another wave of bond market volatility.
Separately, watch the 10-year Treasury yield. It sits near 5.30%, a level at which borrowing costs begin to threaten economic growth. Further increases in yields would heighten pressure on equity valuations.
Conclusion and recommendations
The S&P 500 is holding near record highs, supported by lower near-term Fed hike odds but limited by high bond yields and narrow breadth. Key level for bulls: 7,730.00; for bears: 7,696.00 (200?EMA on the 1-hour chart).
For short-term traders:
- Consider long positions on a sustained breakout above 7,710.00, with targets 7,810.00–7,910.00 and a stop-loss order below 7,690.00.
- Consider short positions on a break below 7,690.00, with targets 7,672.00–7,645.00 and a stop-loss order above 7,710.00.
- Monitor ISM services at 14:00 GMT — it is the key near-term trigger.
For medium?term investors:
- The index remains above key moving averages, supporting a constructive view. Year-end target: 7,900.00 and 8,400.00 by mid-2027, per economist consensus.
- A pullback to 7,650.00–7,585.00 can be used to add long positions with caution.
Risk management:
- Account for elevated volatility around services data.
- Enforce stop-losses strictly, especially on breakout trades.
- Monitor Treasury yields and Fed speakers' commentary.
*This overview is based on public sources and media reports and represents a price action analysis dependent on many factors, so risk management and position monitoring remain essential.
**See also our other reviews:
USDX holds near an annual high, but traders price in an October pause