 English
 Русский
 Bahasa Indonesia
 Bahasa Malay
 ไทย
ไทย Español
 Deutsch
 Български
 Français
 Tiếng Việt
 中文
中文 বাংলা
বাংলা हिन्दी
 Čeština
 Українська
 Română


Analysis GBP/USD 5M
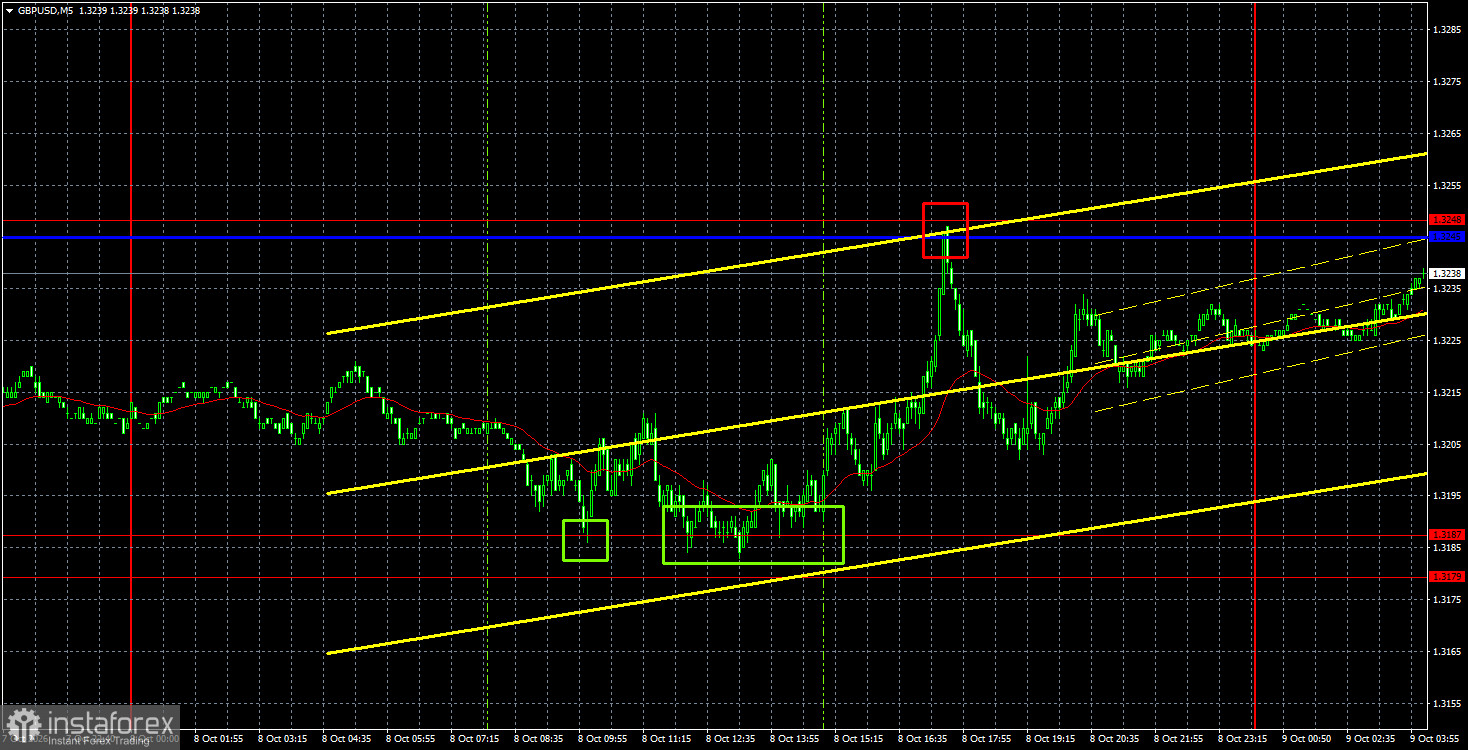
On Thursday, the GBP/USD pair once again failed to break the 1.3179–1.3187 area and has now remained in a sideways channel for more than two weeks. Remember, the key starting point for analysis right now is the sideways channels on the hourly, daily, and weekly timeframes. First, movements inside a flat are always random — on both short and long horizons, traders can see price moves that are very difficult to link to fundamentals or macro events. We've observed this for at least a month. Second, the 1.3179–1.3187 area is part of the broader 1.3150–1.3180 zone, which in turn represents the common lower boundary of all three channels. That means the area can hold price above it, but liquidity is also likely to be swept from the recent lows (both local and larger), after which a reversal to the upside may occur. Geopolitical, macro, and fundamental factors continue to exert weak and contradictory influence on price. Recall that the Bank of England could follow the Federal Reserve and begin tightening at its next meeting; the market sees Fed tightening but does not yet price in BoE tightening.
Technically, the pound continues to form a downtrend despite the trendline breach. Remember, in a flat, a trendline breach means little — a flat is a market pause and shouldn't be used to define the trend. Below the Senkou Span B line, the bearish bias remains.
On the 5-minute TF on Thursday, three trade signals formed, and during the European session price bounced twice from the 1.3179–1.3187 area, allowing traders to open long positions. A few hours later, the 1.3245–1.3248 area was worked through, where traders could close long positions for profit and open short positions. By day's end, the pair had fallen several dozen pips, moves that traders could also have captured.
COT Report
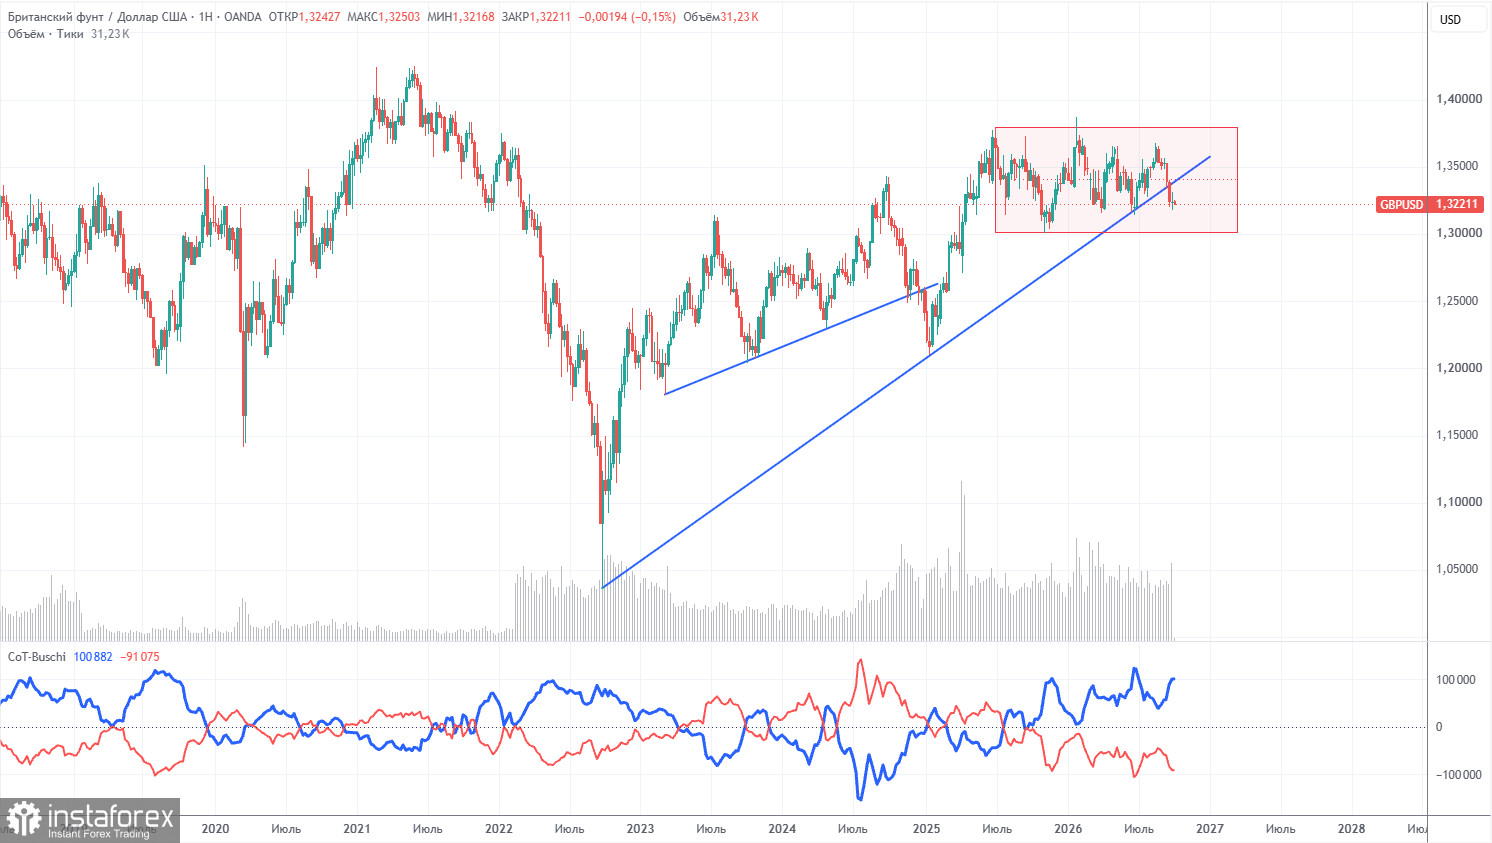
COT reports for the pound show that non-commercial traders have dominated the market with selling for several months. The net position is negative, even as the long-term uptrend remains intact. Given events in the Middle East, it is unsurprising that dollar demand remains high in 2026. The war between the US and Iran formally ended, but a new war inside Yemen has begun. The Federal Reserve's changed stance on monetary policy also supported the dollar, and the uptrend line was breached. However, it was breached under flat conditions, so we do not believe the uptrend is over.
In the long term, the dollar continues to decline due to Donald Trump's policies, which is clearly visible on the weekly TF. The trade war will continue in one form or another for a long time, and Trump's policy aims directly and indirectly to weaken the US currency. The long-term uptrend remains. According to the latest COT report (dated September 29), the "Non-commercial" group closed 13,100 BUY contracts and 4,500 SELL contracts. Thus, non-commercial traders' net position fell by 8,600 contracts over the week.
Analysis GBP/USD 1H
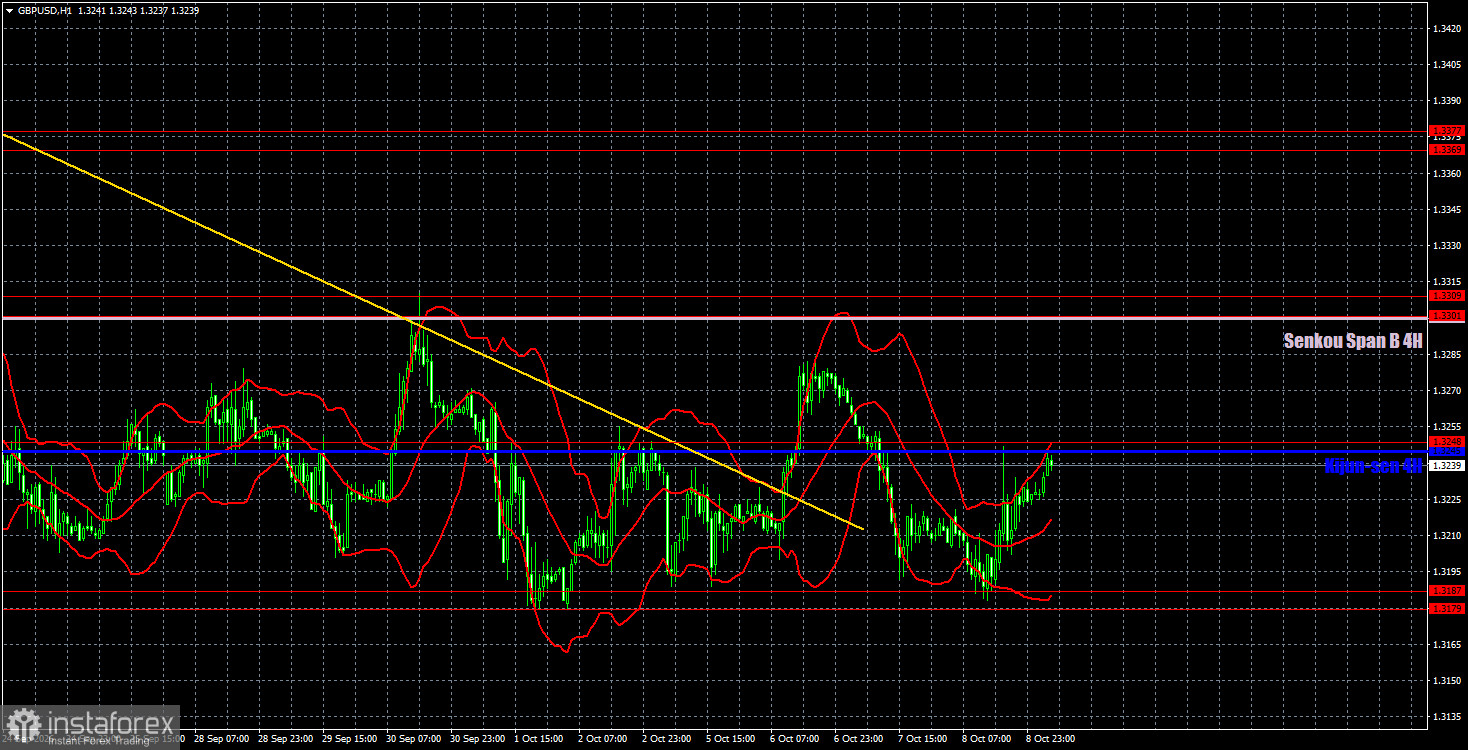
On the hourly timeframe, GBP/USD continues to form a downward trend. The Fed's decision and tone have greatly changed the outlook for the US dollar and the market's attitude toward it. We would say that twice this year a "black swan" has arrived in the market and supported the dollar when no one expected it. Now a third "black swan" — in the form of the war in Yemen, which could potentially lead to a blockade of the Bab-el-Mandeb strait — may arrive.
For October 9 we highlight the following important trading levels: 1.3042–1.3050, 1.3096–1.3115, 1.3179–1.3187, 1.3248, 1.3301–1.3309, 1.3369–1.3377, 1.3465–1.3480, 1.3588, 1.3671–1.3681. The Senkou Span B line (1.3301) and Kijun-sen (1.3245) can also be sources of signals. It is recommended to move Stop Loss to breakeven when price has moved 20 pips in the correct direction. The Ichimoku indicator lines may shift during the day, so take that into account when determining trading signals.
No major releases or events are scheduled in the UK today, while the US will publish the University of Michigan consumer-sentiment index. The pair will most likely remain within the two-week sideways channel today.
Brief summary of the above analysis:
Traders can consider the 1.3179–1.3187 area a target for shorts if the price bounces back from the 1.3245–1.3248 area. A close above 1.3245–1.3248 would make 1.3301–1.3309 targets for longs.
Explanations for the illustrations:
- Price support and resistance levels (resistance/support) — thick red lines around which movement may end. They are not sources of trading signals.
- Kijun-sen and Senkou Span B lines — Ichimoku indicator lines transferred to the hourly timeframe from the 4-hour timeframe. They are strong lines.
- Extreme levels — thin red lines from which the price previously bounced. They are sources of trading signals.
- Yellow lines — trendlines, trend channels, and any other technical patterns.
- Indicator 1 on the COT charts — the size of the net position of each trader category.