 English

 Русский
 Bahasa Indonesia
 Bahasa Malay
 ไทย
 Español
 Deutsch
 Български
 Français
 Tiếng Việt
 中文
 বাংলা
 हिन्दी
 Čeština
 Українська
 Română



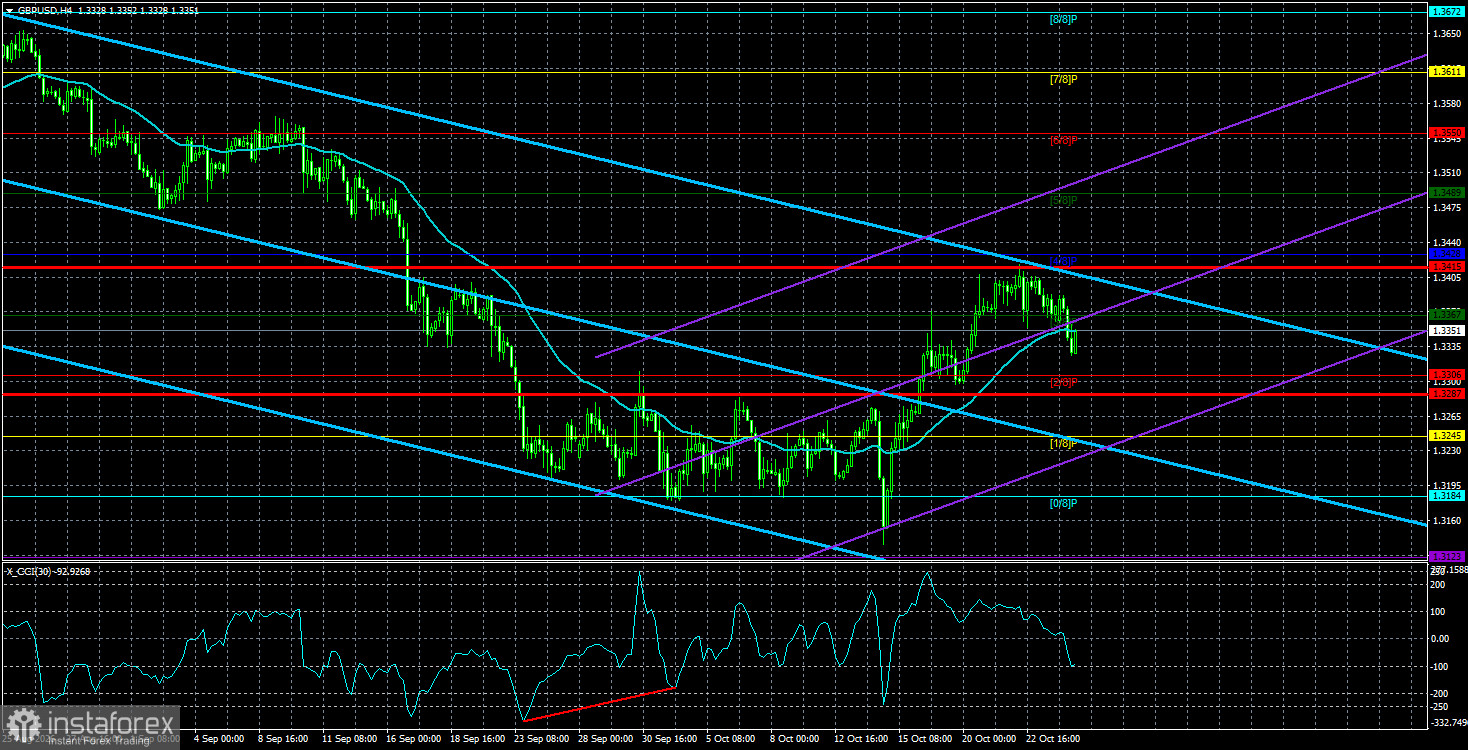
The GBP/USD pair traded fairly calmly on Monday, but with a downward bias, even though no major events occurred on the week's first trading day. In short, the dollar is rising again for reasons that are often simply mechanical. For GBP/USD, technical factors can explain this move. Sterling rallied for more than a week, gaining roughly 270 pips, so a routine technical correction is quite natural. The question is whether this will be a correction or the start of a new dollar trend. Broadly speaking, sterling's situation is similar to the euro's — except that the pound at least sometimes corrects against dollar strength. In plain terms, sterling has been trading more technically in recent months.
The Bank of England has not yet raised its key rate, and that helps explain sterling's weakness in recent months. But there is a flip side: it also means the BoE is likely to tighten policy more than the Federal Reserve over time. Recall that inflation is rising not only in the U.S., but the BoE lacks the same constraints on tightening that some other central banks face. Some analysts point to euro-area weakness or relatively high unemployment to explain a less hawkish ECB (which is not entirely accurate). The BoE does not face those problems: unemployment fell by 0.2 percentage points in August, the economy is growing slowly but steadily, and inflation could reach around 4% by year-end. All this suggests the BoE may deliver at least three rate hikes, and none of those have been fully priced in—because the U.S. dollar has driven most gains over the past two months.
Therefore, looking at the picture overall, there are no solid fundamentals justifying further dollar strength. As a bonus, GBP/USD remains inside a daily sideways channel and, on the weekly timeframe, also sits in a sideways channel. The lower boundaries of those channels have been tested, so technicals point to a move toward the upper boundaries that began about a week ago. What should we conclude ahead of meetings of three central banks — of which only the BoEF is expected to hike — ahead of the U.S. midterms and key macro releases? The dollar could rise again, but only contrary to fundamentals. If the BoE hikes while the Fed does not and the dollar still strengthens, analysts will, of course, write that the Fed was "more hawkish" while the BoE was "dovish." There is always a way to rationalize price action after the fact. We believe sterling's upward move should continue regardless.
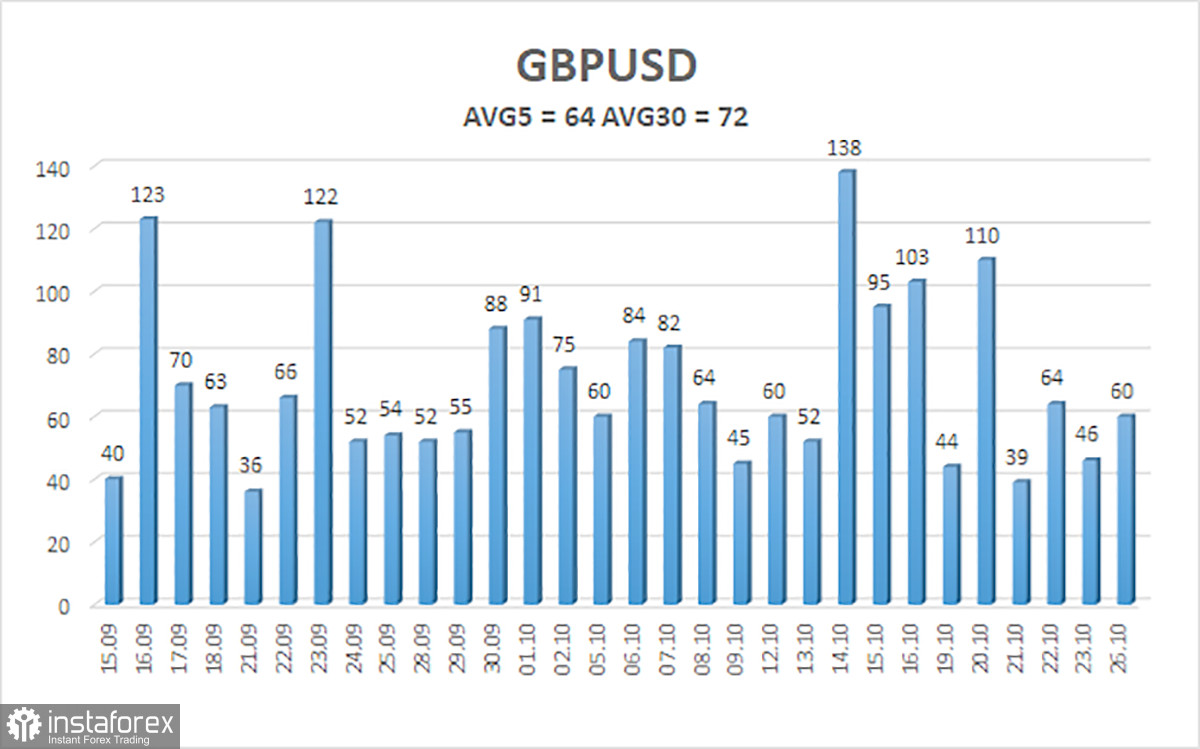
The average volatility of the GBP/USD pair over the last 5 trading days is 64 pips. For the pound/dollar pair, this value is considered "average." On Tuesday, October 27, we therefore expect movement inside a range bounded by 1.3287 and 1.3415. The higher linear-regression channel is turning down again. The CCI entered the oversold area twice and formed a bullish divergence, warning of the end of the downtrend.
Nearest support levels:
S1 – 1.3306
S2 – 1.3245
S3 – 1.3187
Nearest resistance levels:
R1 – 1.3367
R2 – 1.3428
R3 – 1.3489
Trading recommendations:
The GBP/USD currency pair has begun an uptrend that could become the start of a long-term move. Donald Trump's policies will continue to pressure the U.S. economy, so we do not expect long-term strength from the American currency. So far, 2026 has been positive for the dollar due to geopolitics and inflation, which forced capital to seek safety and the Fed to return to tightening monetary policy. However, on the weekly TF, price remains flat between 1.3150 and 1.3780 within a four-year uptrend, supporting expectations for sterling's medium-term rise. Consider long positions with targets of 1.3415 and 1.3428 while the price is above the moving average. When price is below the moving average, you can trade the downside with targets of 1.3306 and 1.3287.
Explanations for the illustrations:
- Linear regression channels help determine the current trend. If both are directed the same way, the trend is currently strong.
- The moving average line (settings 20,0, smoothed) defines the short-term tendency and the direction in which trading should be conducted now.
- Murray levels are target levels for moves and corrections.
- Volatility levels (red lines) show the likely price channel the pair will trade in over the next 24 hours, based on current volatility indicators.
- The CCI indicator — entering the oversold area (below -250) or the overbought area (above +250) — signals an imminent trend reversal in the opposite direction.